Food Hydrocolloids| 卡拉胶与超声处理对皱胃酶酪蛋白乳液性质的影响及机制解析:乳液稳定性、分子间作用力、凝胶结构与质构特性
近日,湖南农业大学团队在《Food Hydrocolloids》期刊上发表了题为《Insight into the effects and mechanisms of carrageenan and sonication on the properties of rennet casein emulsion: Emulsion stability, intermolecular forces, gel structure, and textural properties》的研究性论文(一区,IF:13.8)。该研究针对低乳化盐条件下皱胃酶酪蛋白乳化与凝胶性能不足、制约健康乳基食品开发的问题,在模拟乳超滤液体系中系统探究了卡拉胶与超声辅助乳化联用对皱胃酶酪蛋白乳液及凝胶的调控效应与作用机制。研究筛选发现 0.2% ι- 卡拉胶可最优提升乳液稳定性与乳化活性;二者联合处理可将乳液体积平均粒径从 31.03 μm 降至 3.54 μm,显著提高 zeta 电位绝对值与界面润湿性,同时大幅增强乳液凝胶的硬度、咀嚼性、持水性与粘弹性。研究揭示联合处理通过削弱疏水相互作用、强化静电相互作用,构建致密均匀的凝胶网络以改善质构,为低钠乳基食品及新型乳液凝胶产品开发提供了理论支撑。
乳液凝胶是奶酪、乳化肉制品、酸奶等传统食品的核心结构基础,也决定着 3D 打印食品、功能食品等新型食品的质构、口感与消化特性,乳源蛋白因优异的乳化活性、成胶能力与持水性,是构建乳液凝胶最常用的天然原料。皱胃酶酪蛋白由皱胃酶凝乳制备而成,保留了牛乳酪蛋白的天然结构与高钙含量,可赋予乳制品良好的质构与风味,但其溶解度与乳化性能弱于酪蛋白酸钠,传统加工需添加大量乳化盐以促进酪蛋白分散、水化与乳化,而过量钠摄入会升高高血压、心血管疾病等健康风险,因此在低乳化盐条件下提升皱胃酶酪蛋白的乳化与凝胶性能,是开发健康乳基食品的核心需求。卡拉胶作为红藻来源的天然硫酸化多糖,可通过与蛋白的相互作用调控体系的乳化与凝胶特性,但不同类型卡拉胶对皱胃酶酪蛋白乳液凝胶体系的作用规律尚未明确;超声辅助乳化是绿色高效的加工手段,虽可一定程度改善低乳盐条件下皱胃酶酪蛋白乳液的稳定性,但单独处理仍难以满足后续加工要求,二者联合调控的效应与分子机制也尚未被系统阐明。基于此,该研究在模拟乳超滤液体系中开展实验,筛选最优卡拉胶类型与添加浓度,系统探究超声与 ι- 卡拉胶联合处理对皱胃酶酪蛋白乳液及凝胶性质的调控规律,从分子间作用力、微观结构层面解析作用机制,为低钠健康乳基食品的开发提供理论支撑。
ι- 卡拉胶是调控皱胃酶酪蛋白乳液的最优卡拉胶类型
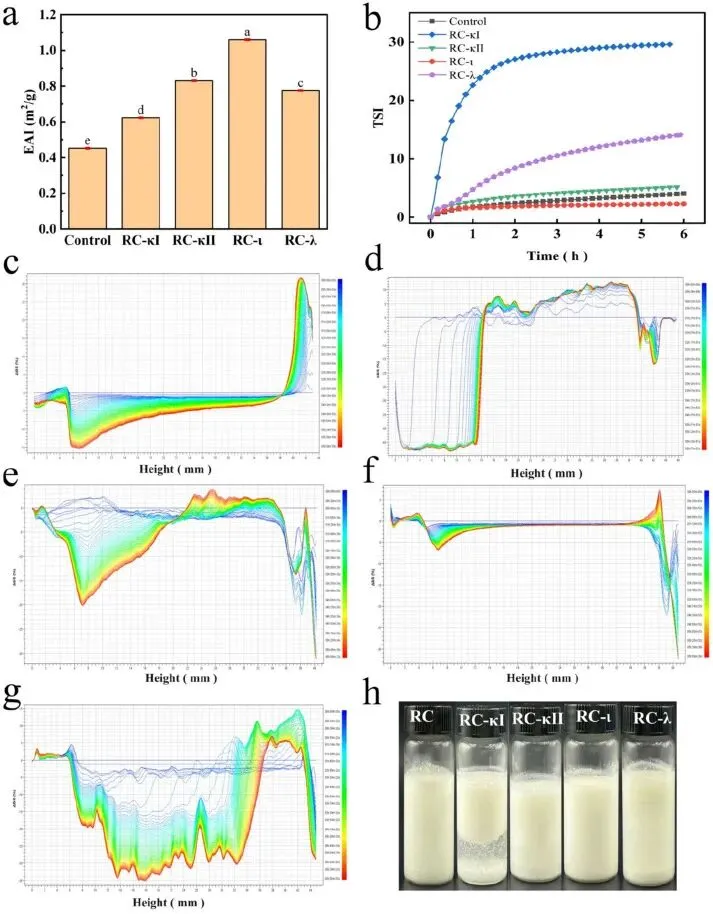
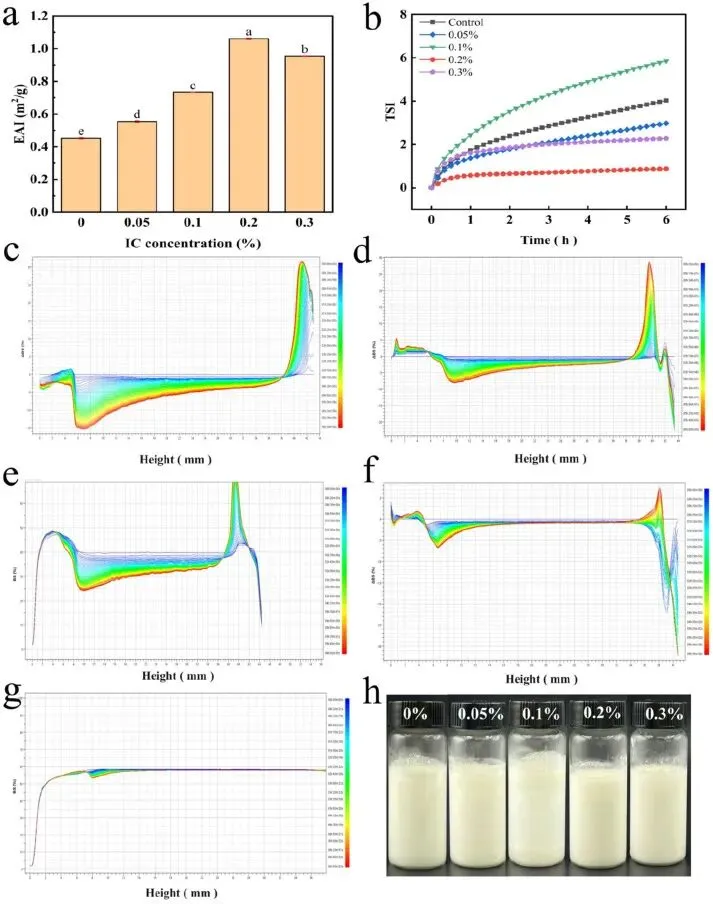
在四种常见卡拉胶中,仅 ι- 卡拉胶可同时提升乳液的乳化活性指数与储存稳定性,κI、κII 与 λ 型卡拉胶均会不同程度加剧乳液的分层失稳。浓度优化结果显示,0.2% 为 ι- 卡拉胶的最优添加量,此时乳液乳化活性达到峰值,储存过程中不稳定指数最低;添加浓度过低易引发液滴桥联絮凝,过高则会导致蛋白 - 多糖聚集,均会造成乳液稳定性下降。
联合处理可全方位优化乳液的界面与物理稳定特性
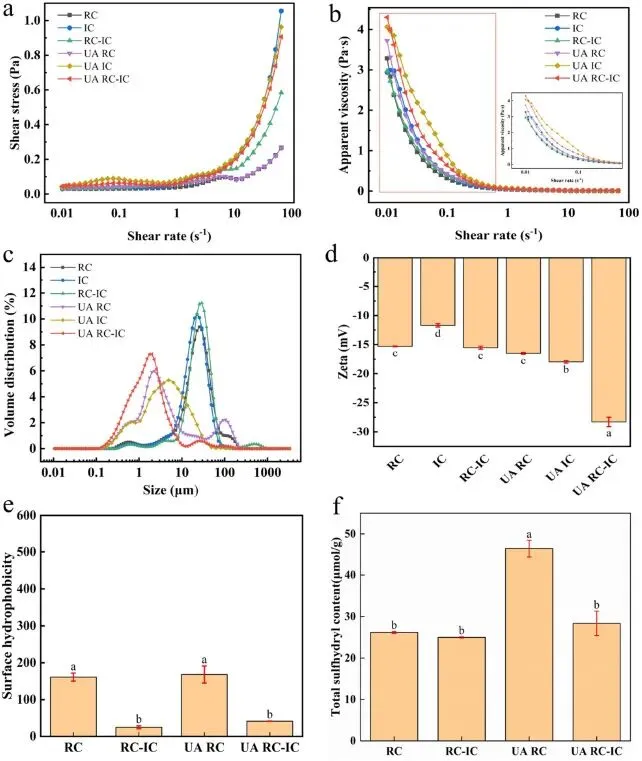
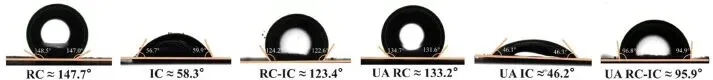
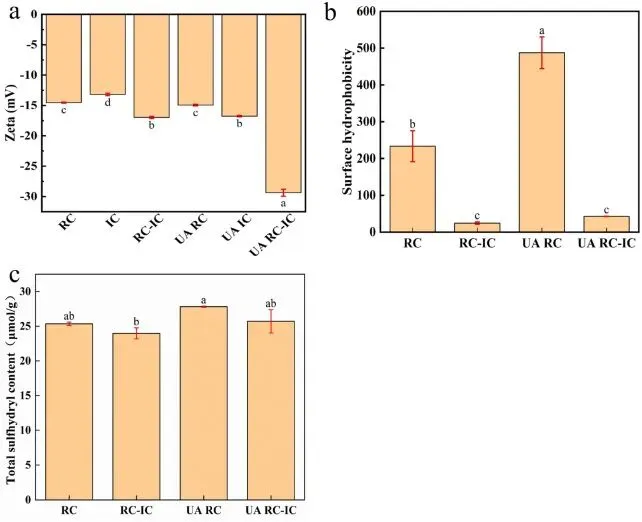
超声与 ι- 卡拉胶联合处理可显著细化乳液液滴,将体积平均粒径 D₄,₃从 31.03 μm 降至 3.54 μm,同时提升体系黏度与 zeta 电位绝对值至 28.30 mV,通过空间位阻与静电排斥双重作用强化乳液储存稳定性。界面性质层面,联合处理可调节蛋白的表面疏水性与巯基暴露水平,使水接触角降至 95.9°,实现油水界面的亲疏水平衡,构建更坚韧的界面膜结构。
联合处理显著提升乳液凝胶的质构、持水与流变性能
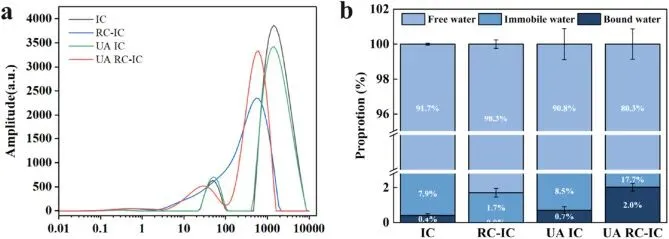
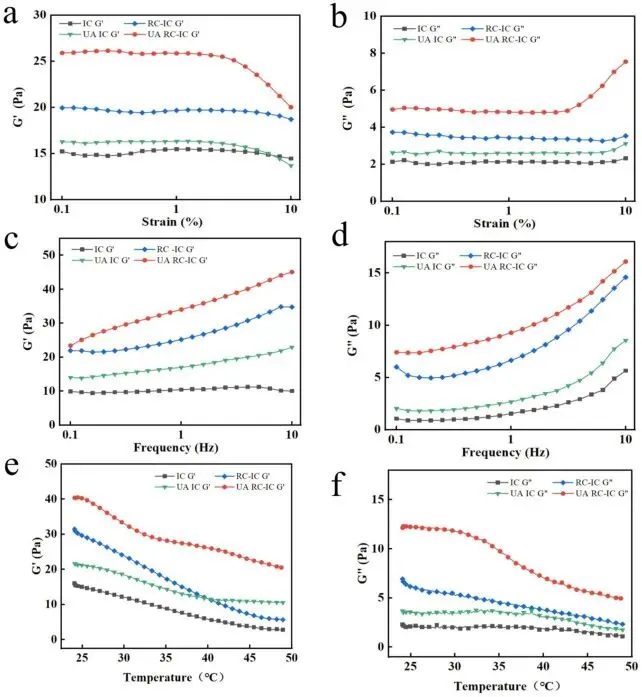
低乳化盐条件下,单一皱胃酶酪蛋白难以形成稳定的乳液凝胶,联合处理后凝胶硬度可达 66.49 g,胶黏性与咀嚼性同步大幅提升。水分分布结果显示,联合处理使凝胶自由水占比从 91.7% 降至 80.3%,结合水与不易流动水占比显著升高,持水能力显著增强。流变学测试表明,联合处理的凝胶在全测试应变与频率范围内均具有最高的储能模量与损耗模量,屈服应力更高,热稳定性更优,整体呈现更强的弹性凝胶特征。
二者通过分子作用力调控与结构致密化实现协同增效
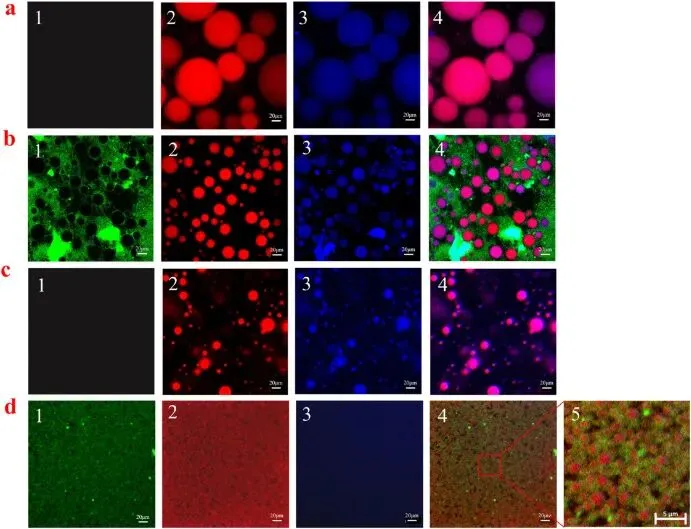
机制研究表明,超声的空化效应可促进皱胃酶酪蛋白解折叠与充分分散,消除蛋白聚集体,为卡拉胶的结合提供更多作用位点;联合处理可强化体系静电相互作用,削弱过度的疏水聚集,同时调控二硫键的形成过程,最终构建出油滴细小均一、蛋白 - 多糖网络致密连续的微观凝胶结构,从分子、界面到微观多尺度协同提升乳液与凝胶的综合性能,为低钠乳基乳液凝胶产品的质构调控提供了可行路径。
Fig. 1. Effects of carrageenan type on the properties of rennet casein-corn oil emulsion. Images of a is the EAI, b is the TSI, c-g are the ΔBS and storage stabilities of rennet casein emulsion after κⅠ-carrageenan (RC-κⅠ), κⅡ-carrageenan (RC-κⅡ), ι-carrageenan (RC-ι), and λ-carrageenan (RC-λ) additions. The images c-g are the ΔBS results of Control, RC-κⅠ, RC-κⅡ, RC-ι, and RC-λ during 6-h storage. Different lowercase (a-e) letters in image a indicate significant differences between different samples at the P < 0.05 level.
Fig. 2. Effects of ι-carrageenan concentrations on the properties of rennet casein-corn oil emulsion. Images of a is the EAI, b is the TSI, c-g are the changes of ΔBS and storage stabilities of rennet casein emulsion after different ι-carrageenan additions (0%-0.3%). The images c-g are the ΔBS results of rennet casein emulsion after 0%, 0.05%, 0.1%, 0.2%, and 0.3% ι-carrageenan additions during 6-h storage. Different lowercase letters (a-e) in image a indicate significant differences between samples at the P < 0.05 level.
Fig. 3. Effects of UA and ι-carrageenan addition on properties of rennet casein emulsions. Image of a and b are the rheological properties, c is the droplet size distribution, d is the zeta potential, e is the surface hydrophobicity, and f is the total sulfhydryl content of different emulsions. Different lowercase (a-c) letters in image d indicate significant differences between different samples at the P < 0.05 level.
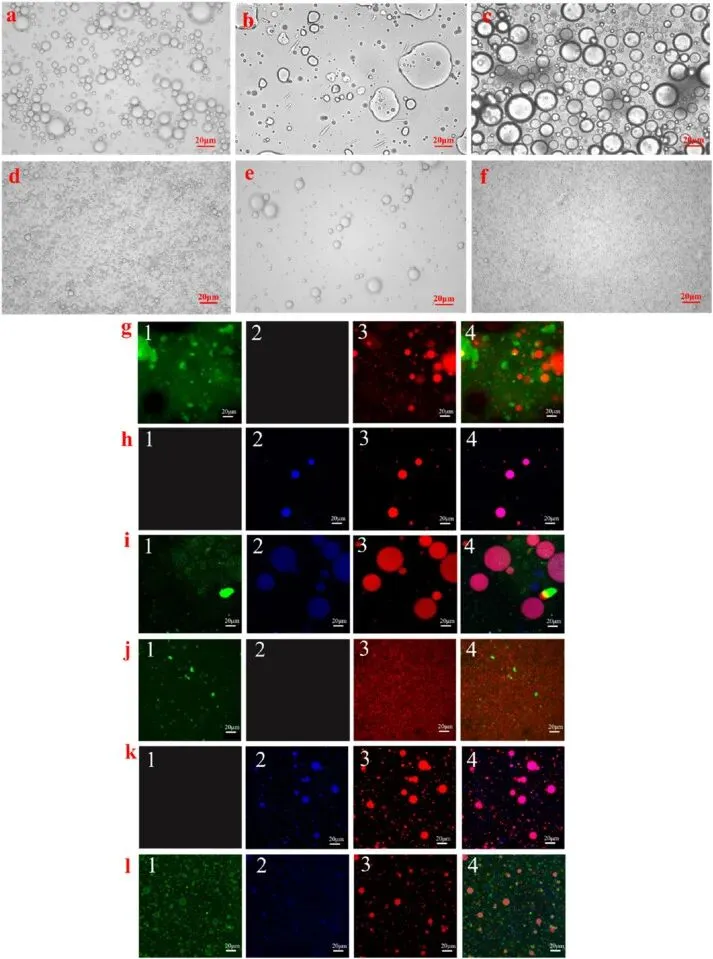
Fig. 4. Effects of UA and ι-carrageenan addition on droplet size distribution of rennet casein emulsions. Images a-f are obtained from the optical microscope, and g-l are obtained from the confocal laser scanning microscope. Images a and g are the RC samples, b and h are the IC samples, c and i are the RC-IC samples, d and j are the UA RC samples, e and k are the UA IC samples, and f and l are the UA RC-IC samples. The numbers 1-3 in images g-l represent the distribution of protein, carrageenan, and oil, and number 4 represents their combination. The scale bar in the figures is 20 μm.
Fig. 5. Effects of UA and ι-carrageenan addition on the water contact angle of different emulsions.
Fig. 6. Effects of UA and ι-carrageenan addition on the water distributions of different emulsion gels.
Fig. 7. The rheological properties of different emulsion gels. Images a-b are the strain test, c-d are the frequency test, and e-g are the temperature test. G′ is the storage modulus, and G″ is the loss modulus.
Fig. 8. Effects of UA and ι-carrageenan addition on gel structure of rennet casein emulsion gels. Images of a is the IC samples, b is the RC-IC sample, c is the UA IC sample, and d is the UA RC-IC sample. The 1-3 in images represent the distribution of protein, carrageenan, and oil distribution, 4 represents their combination, and 5 is the magnified view of a specific area. The scale bar in the figures is 20 μm, while in image d5 is 5 μm.
Fig. 9. Effects of UA and ι-carrageenan addition on the intermolecular forces of rennet casein. Image of a represents zeta potential, b represents surface hydrophobicity, and c represents total sulfhydryl content of rennet casein emulsion gels. Different lowercase (a-d) letters in image d indicate significant differences between different samples at the P < 0.05 level.
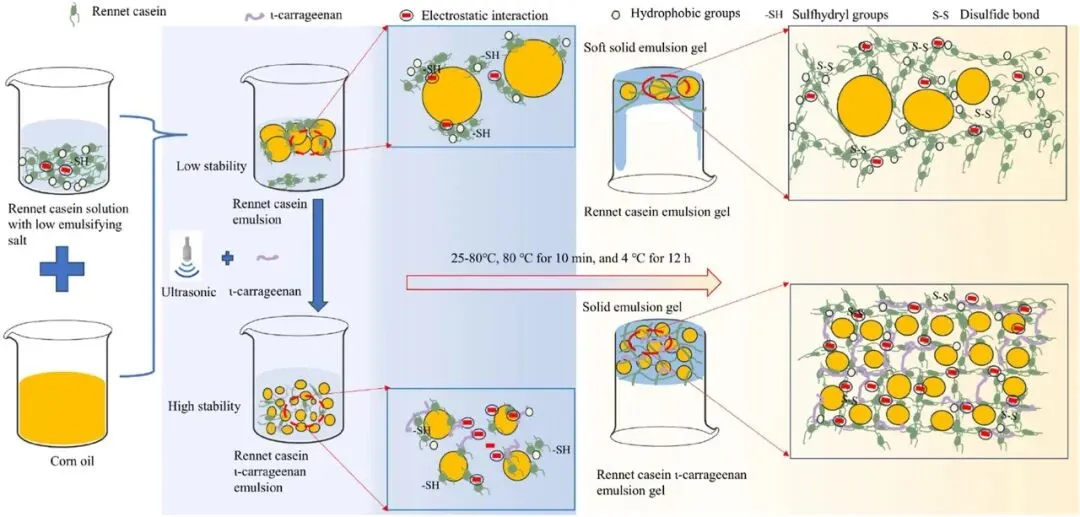
Fig. 10. Possible mechanisms of the effects of UA and ι-carrageenan treatment on rennet-casein emulsions and emulsion gels.
https://doi.org/10.1016/j.foodhyd.2026.112998
免责声明:「原创」仅代表原创编译,水平有限,仅供学术交流,本平台不主张原文的版权,如有侵权,请联系删除。文献解读或作者简历如有疏漏之处,我们深表歉意,请作者团队及时联系《食探未来》主编(微信号:shitanweilai8077),我们会在第一时间进行修改或撤稿重发,感谢您的谅解!