RCR | 小麦、水稻和玉米体系中不同农业管理措施下N2O排放与产量权衡关系的全球荟萃分析
- 2026-06-26 04:17:42
文章信息
文章标题:A global meta-analysis of N2O emission-yield trade-offs in wheat, rice and maize systems under different agricultural management
中文标题:小麦、水稻和玉米体系中不同农业管理措施下N2O排放与产量权衡关系的全球荟萃分析
发表期刊:Resources, Conservation & Recycling
发表时间:2025.11
影响因子:IF = 10.9
第一作者:曾嘉
通讯作者:韩新辉 教授
通讯单位:西北农林科技大学农学院
文章摘要
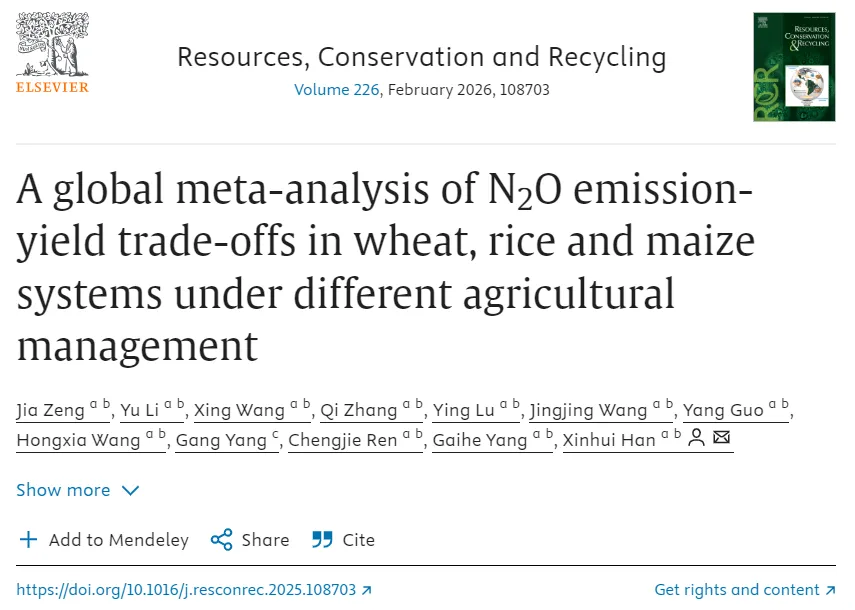
提高农业生产力和减少N2O排放的协同优化是全球农业可持续性的核心挑战。本研究将792项田间试验(6678观测)与荟萃分析和机器学习相结合,评估了9种管理实践对N2O排放、作物产量和产量标度N2O排放的影响。与标准合成肥料(SY)相比,生物炭(BI)、有机肥替代(OF_SY)和增效氮肥(EENF)表现出协同效应:减少N2O排放(15.6-32.2%),增加产量(4.6-7.6%),减少产量规模的N2O排放(23.7-35.2%)。相比之下,SY、有机肥料或其组合导致了“高产-高排放”的结果,提高了产量规模的N2O排放量(15.7-70.5%)。全球空间预测表明,of_SY(-27.6%)、EENF(-45.7%)、秸秆还田(SR,-8.1%)、BI(-23.9%)和少耕/免耕(RNT,-16.8%)的最佳实施同时提高了产量,全球协调部署进一步将产量规模的N2O排放量减少了46.7%。总体而言,我们建立了一个指导农业实践以缓解气候变化的框架。
文章思路与特点
这篇论文通过全球Meta分析整合小麦、水稻和玉米田间试验数据,系统评估不同农业管理措施下作物产量与N₂O排放之间的权衡关系。写作思路上,以“增产–减排”双目标为核心,从管理措施出发,同时量化产量变化和N₂O响应,构建权衡指标,比较各类管理方式在二维空间中的表现。
文章特点在于突破传统单一指标评价,强调trade-off视角,突出氮利用效率在实现“增产不增排”中的关键作用;同时结果表达具有较强的政策导向性,为可持续农业管理提供定量依据。
全球尺度的Meta地图热图制作流程本质上是将文献中的效应量统计结果与空间信息进行融合可视化,其基本思路是先从全球田间试验文献中提取试验点的地理坐标、效应量(如lnRR或Hedges’g)及样本量,构建包含空间属性的数据表;随后将数据转为空间对象并投影到统一坐标系的世界底图上,对空间上密集的试验点按网格或区域进行聚合计算加权平均效应量,以避免点位过度重叠;再对效应量进行标准化或分级处理,统一颜色映射范围,最后通过颜色梯度渲染生成热图,从而直观展示不同管理措施或处理效应在全球尺度上的空间分布格局与区域差异。
文章图表
Graphical abstract
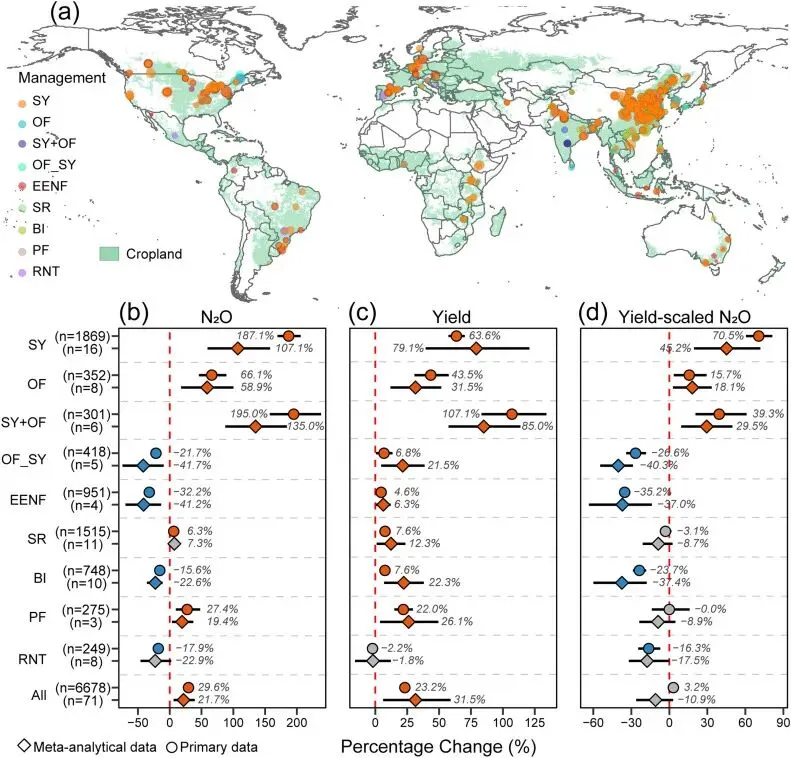
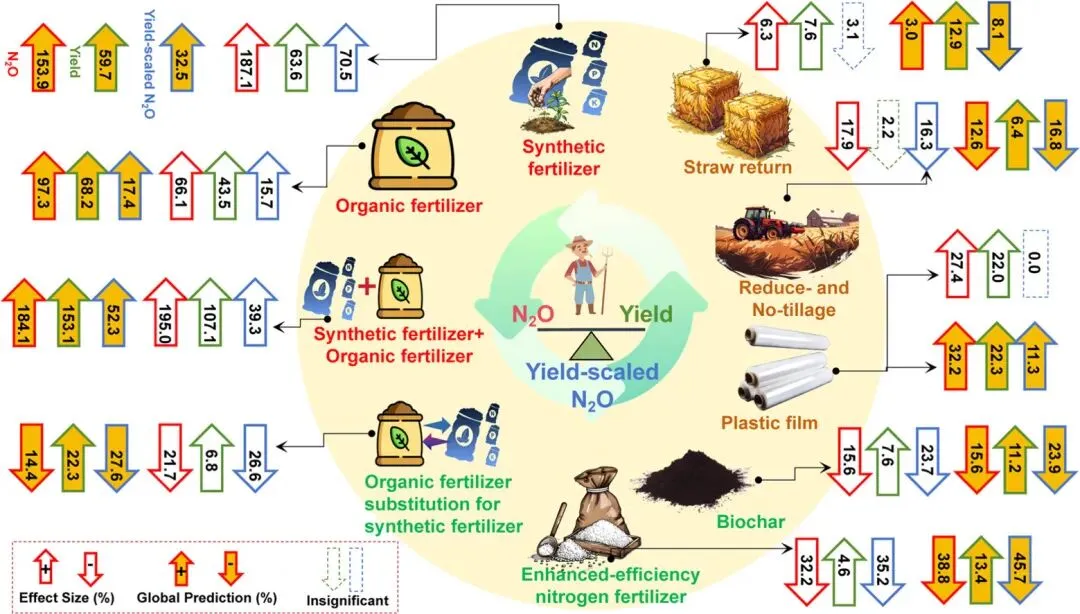
Fig. 1. (a) Global geographical distribution of field trial samples included in the meta-analysis; (b-d) Based on primary data and published meta-analysis data, the impacts of management practices on N2O emissions (b), crop yield (c), and yield-scaled N2O emissions (d) are respectively demonstrated. Colored points in the map correspond to different management practices, with point size proportional to the number of observations. Forest plot data present effect sizes (percentage) with error bars indicating 95% confidence intervals. Values adjacent to data points denote percentage effect sizes. Red, blue, and gray points represent significant positive, significant negative, and non-significant effects, respectively. Abbreviations: SY (synthetic fertilizer), OR (organic fertilizer), SY+OF (synthetic + organic fertilizer), OF_SY (Organic fertilizer substitution for synthetic fertilizer), EENF (enhanced-efficiency nitrogen fertilizer substitution substitution for synthetic fertilizer), SR (straw return), BI (biochar), PF (plastic film mulching), RNT (Reduced- and no-tillage), and ALL (cumulative effects of all treatments). Numbers in parentheses following treatments indicate observation counts. The map base layer delineates study regions and does not represent officially recognized national boundaries.
Fig. 2. Moderating effects of crop types on N2O emissions (a), yield (b), and yield-scaled N2O emissions (c) under different management practices. Forest plots display effect sizes (percentage) with error bars representing 95% confidence intervals. Values adjacent to data points indicate percentage effect magnitudes. Colored points denote significant positive (red), significant negative (blue), and non-significant effects (gray), with shape variants corresponding to distinct crop types. Numbers in parentheses following treatments indicate observation counts.
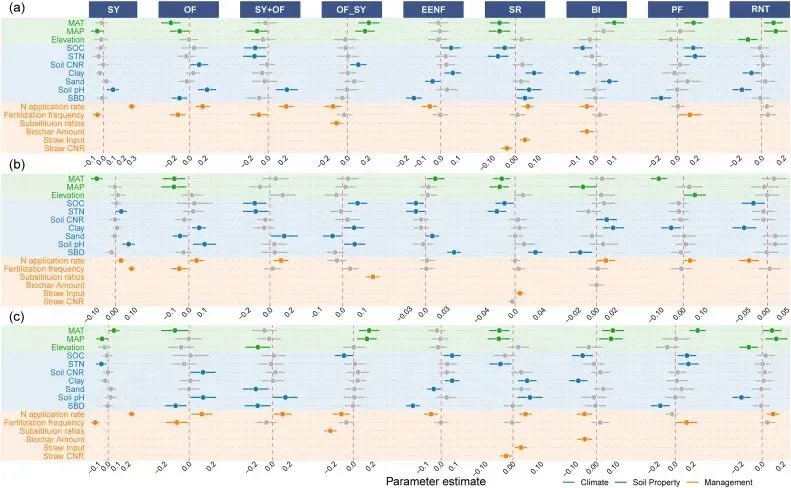
Fig. 3. Parameter estimates of climate, soil, and field management effects on N2O emissions (a), yield (b), and yield-scaled N2O emission variation (c) under different management practices. Light green, light blue, and pale yellow shading denote climate, soil, and field management factors, respectively. Mixed-effects meta-regression results are presented as mean percentage changes with error bars indicating 95% confidence intervals. Green, blue, and yellow points indicate statistically significant influences, while gray points represent non-significant effects.
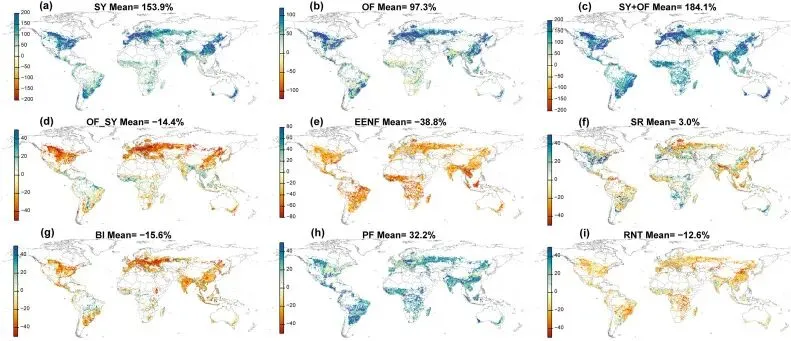
Fig. 4. Spatial projections of the effects of various management practices on N2O emissions. Model performance evaluation and variable importance ranking are provided in Supplementary Fig.s S13, 14, 15.
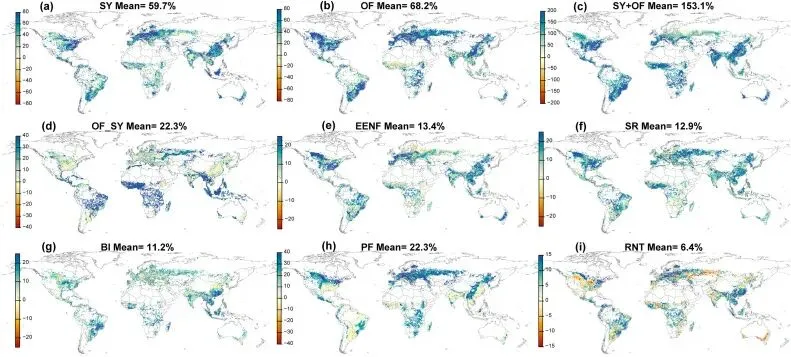
Fig. 5. Spatial projections of the effects of various management practices on crop yield. Model performance metrics and variable importance rankings are available in Supplementary Fig.s S16, 17, 18.
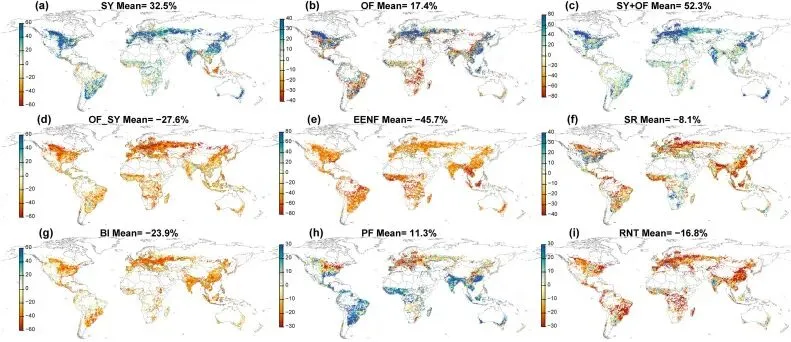
Fig. 6. Spatial projections of the effects of various management practices on yield-scaled N2O emissions. Model validation statistics and predictor importance analyses are detailed in Supplementary Fig.s S19, 20, 21.
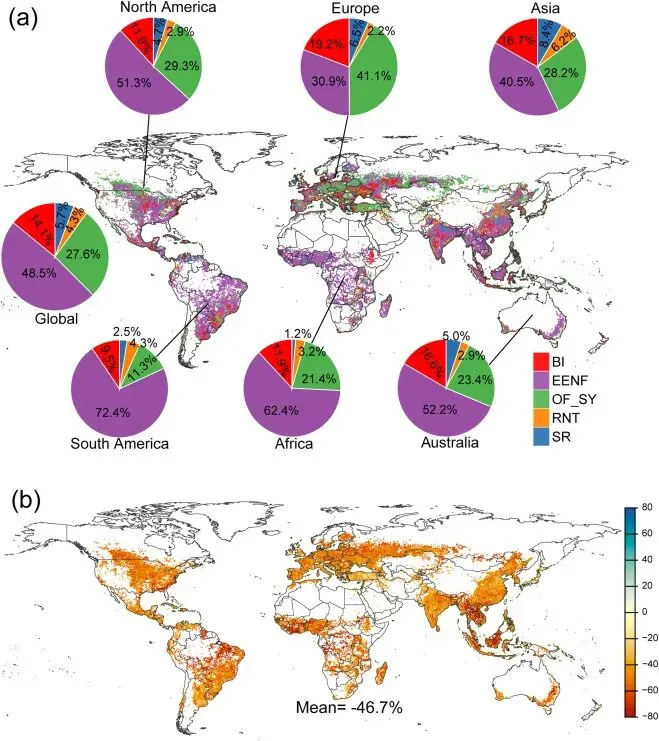
Fig. 7. (a) Global optimal distribution patterns of OF_SY, EENF, BI, RNT and SR practices; (b) Spatial projections of relative mean changes in yield-scaled N2O emissions under combined implementation of these five management practices. The pie chart illustrates the distribution of the five management practices, presenting a global overview along with a continental breakdown.
原文链接:https://www.sciencedirect.com/science/article/pii/S0921344925005804?via%3Dihub#ecom0001
随机文章
-
 10个月宝宝每天需要喝多少奶粉?
- 哈巴河县林业和草原局在萨尔布拉克镇召开草原确权工作现场推进会
- 伊金霍洛旗林业和草原局开展春节前安全生产检查工作
- 林业新闻丨2026年2月5日阿里河新闻
- 35人!上海市农业科学院工作人员公开招聘,4月10日截止!
- 伊金霍洛旗林业和草原局开展节前防火禁牧综合宣传 筑牢生态安全“双防线”
- 专论综述|中国林业科学研究院木材工业研究所林兰英研究员团队:木材弱界面对其变形和韧性的影响研究进展
- 北大荒集团宝泉岭分公司蓄力“四个农业”建设 夯实粮食安全根基
- 农业银行四川分行资产提升活动怎样参加,大部分人不懂姿势
- 绿的播种者——记陕西省林业专家郑文翰
- 九江市农业科学院召开2026年工作务虚会
