You should spend about 20 minutes on this task.
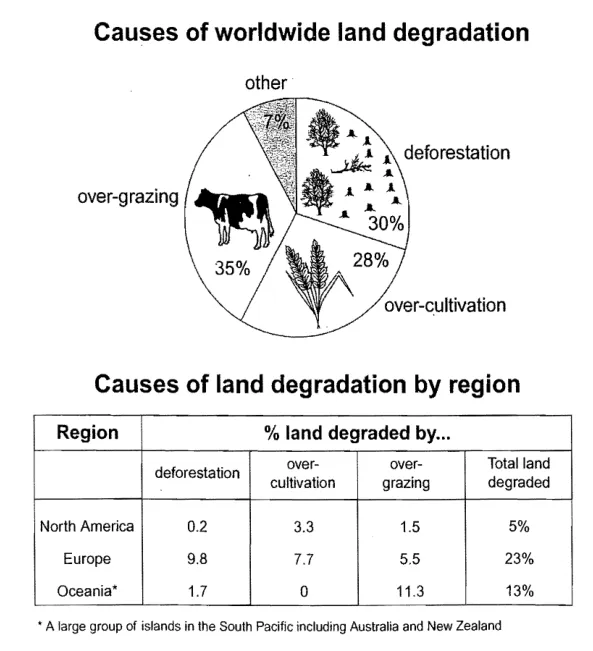
The pie chart below shows the main reasons why agricultural land becomes less productive. The table shows how these causes affected three regions of the world during the 1990s.
Summarise the information by selecting and reporting the main features, and make comparisons where relevant.
Write at least 150 words.
The pie chart illustrates three main causes for declining agricultural land productivity, and the table demonstrates their effects on land degradation across three continents during the 1990s.Overall, although over-grazing, deforestation and over-cultivation varied in their degree of influence, they exerted roughly equivalent destructive impact on land productivity. Notably, Europe suffered the most severe land degradation, followed by Oceania, while the primary factors damaging agricultural land varied across continents.段落3(细节段):
Over-grazing accounted for 35% of land loss, followed by deforestation at 30% and over-cultivation at 28%, with the remaining 7% coming from other factors.
段落4(细节段):
Europe suffered the most extensive land degradation in the 1990s, at 23%, with deforestation being the primary cause at 9.8%, followed by over-cultivation at 7.7% and over-grazing at 5.5%. Oceania saw a 13% loss, of which 11.3% was from over-grazing and only 1.7% from deforestation, whereas over-cultivation had no impact in this region. Though North America experienced the least land damage, with only 5% loss, over-cultivation accounted for 3.3%, over-grazing 1.5% and deforestation a negligible 0.2%.
(169词)
9分作文范文:
The pie chart illustrates the principal causes of worldwide land degradation, while the table provides a regional breakdown of how these factors affected North America, Europe and Oceania during the 1990s.
Overall, over-grazing, deforestation and over-cultivation — though ranked in descending order of influence — accounted for roughly equivalent proportions of global land degradation. However, both the severity and the dominant causes varied markedly across the three regions.
段落3(细节段):
Globally, over-grazing was the leading factor at 35%, closely followed by deforestation (30%) and over-cultivation (28%). The remaining 7% came from other causes.
段落4(细节段):
Turning to the regional data, Europe suffered the most extensive degradation (23%). In contrast to the global pattern, deforestation was the primary culprit here (9.8%), though over-cultivation (7.7%) and over-grazing (5.5%) also played substantial roles. Oceania recorded the second-highest proportion (13%), but its profile was strikingly different: over-grazing alone accounted for 11.3%, while over-cultivation had no impact whatsoever. In sharp contrast, North America experienced the lowest overall degradation (just 5%), with over-cultivation emerging as its dominant factor (3.3%), whereas deforestation contributed negligibly (0.2%). Notably, each region exhibited a distinct degradation pattern, with no single cause prevailing universally.
(188词)

 10个月宝宝每天需要喝多少奶粉?
