Food Hydrocolloids| 海藻酸钠 - 蛋壳粉协同稳定无糖戚风蛋糕中的蛋清蛋白泡沫:界面流变学、多尺度结构与应用性能
近日,华中农业大学团队在《Food Hydrocolloids》期刊上发表了题为《Sodium alginate–eggshell powder synergy for stabilizing egg white foams in sugar-free chiffon cakes: Interfacial rheology, multiscale structure, and performance》的研究性论文(一区,IF:12.4)。该研究针对无糖戚风蛋糕体系中蛋清蛋白泡沫易失稳的痛点,探究了海藻酸钠(SA)与蛋壳粉(EP)对蛋清蛋白发泡特性的协同调控作用,分析了复配体系对泡沫性能、多尺度结构、界面流变特性及蛋糕品质的影响,揭示了二者可通过蛋白 - 多糖复合、钙离子介导的交联效应及颗粒 Pickering 稳定机制,协同强化泡沫的体相与界面结构,最优配方实现了 100% 的泡沫稳定性,同时显著优化了无糖戚风蛋糕的孔隙结构与质构特性,也为蛋壳副产物的高值化利用提供了可行方案。
随着消费者健康意识提升,无糖 / 低糖烘焙产品的市场需求持续增长,但蔗糖的缺失会严重影响充气烘焙产品的品质。蛋清蛋白泡沫是戚风蛋糕等充气烘焙产品的结构核心,无糖体系中,可溶性固形物减少会降低体系连续相粘度,加速泡沫排水、气泡聚并与奥斯特瓦尔德熟化,同时削弱蔗糖对蛋白热变性的保护作用,易导致蛋糕塌陷、内部气孔粗糙不均。现有蛋白 - 多糖复合稳定方案多依赖体相增稠,界面强化效果有限,且缺乏实际烘焙体系的系统验证;蛋壳粉是蛋品加工的主要副产物,全球每年约 787 万吨蛋壳被丢弃,造成严重的资源浪费与环境负担,现有研究多将其用作填料或油水体系 Pickering 稳定剂,在气 - 水界面与食品泡沫稳定领域的应用仍存在较大空白,海藻酸钠与蛋壳粉协同调控蛋清蛋白泡沫的稳定机制尚未明确。
泡沫性能的协同调控效应
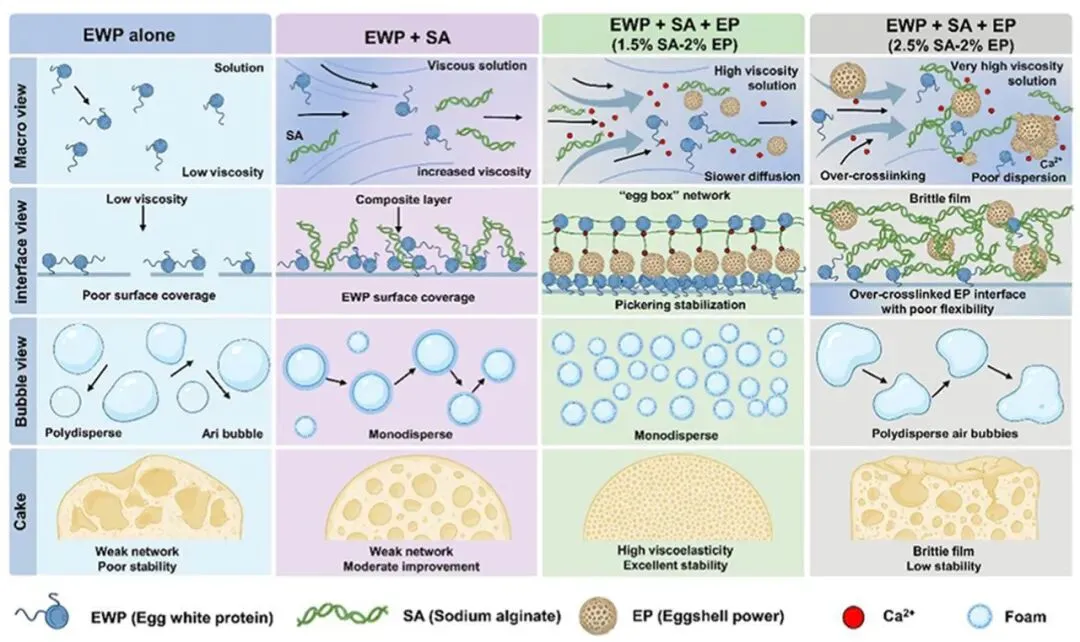
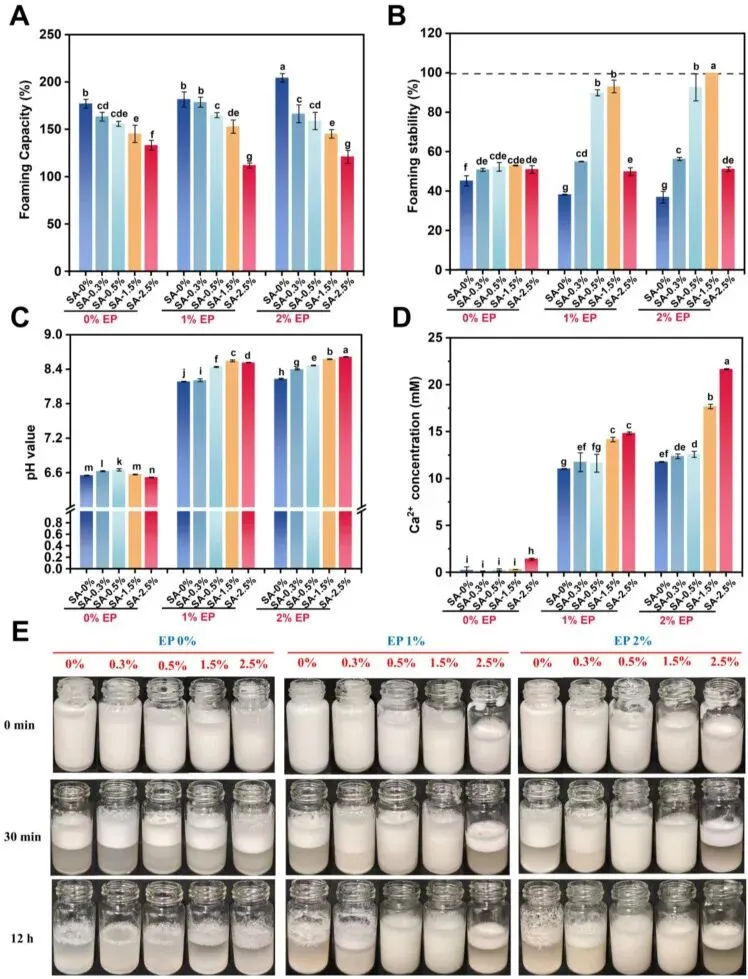
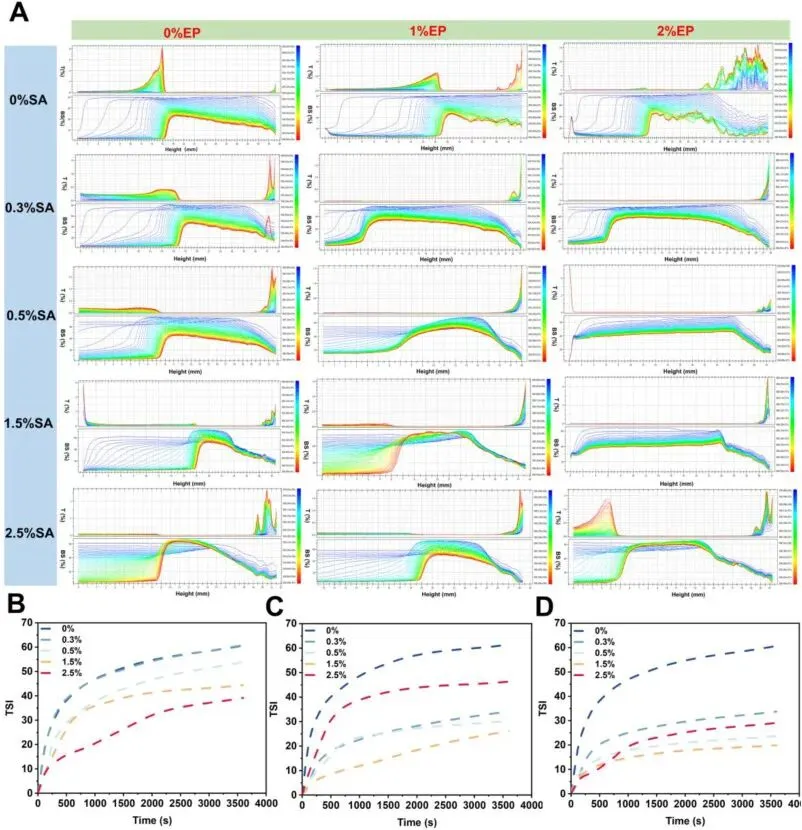
无蛋壳粉添加时,海藻酸钠的增稠作用会阻碍蛋清蛋白向气 - 水界面的扩散与吸附,使发泡能力最高下降 24.78%,仅能小幅提升泡沫稳定性;二者复配后呈现显著的协同稳定效应,发泡能力与泡沫稳定性均大幅提升,其中 1.5% 海藻酸钠 - 2% 蛋壳粉的最优配方发泡能力达 204.54%,泡沫稳定性达 100%,Turbiscan 稳定性指数(TSI)最低,可有效抑制泡沫排水、聚并与粗化,静置 12 小时仍能维持稳定的泡沫结构。
体系分子作用与理化稳定机制
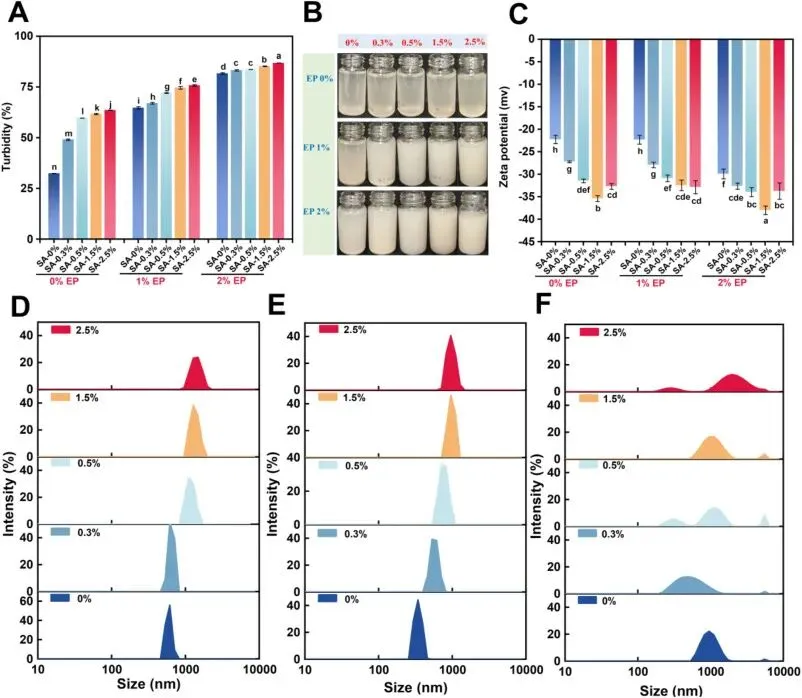
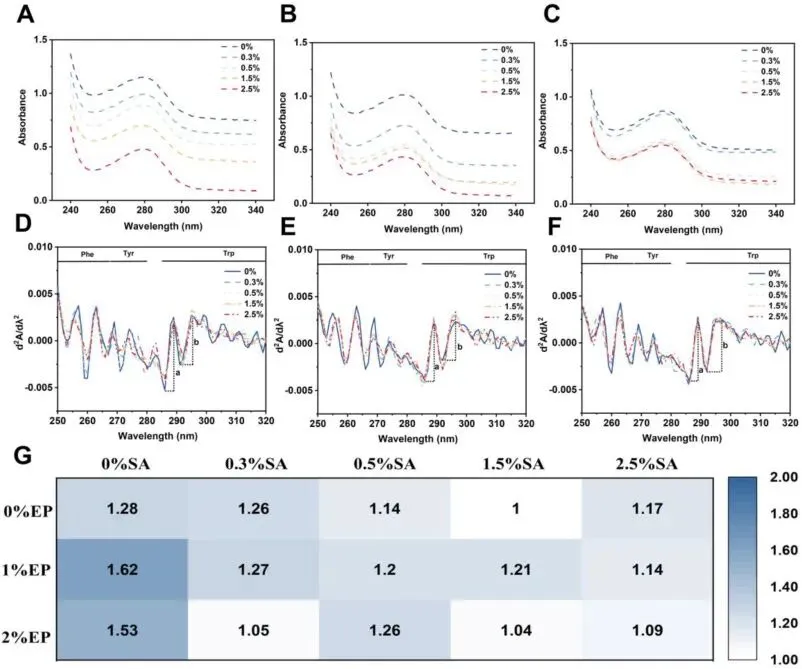
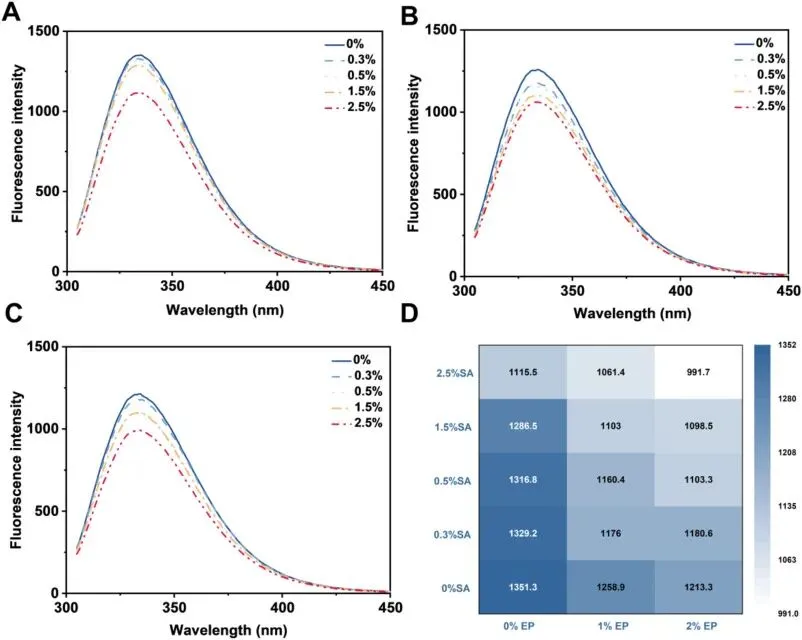
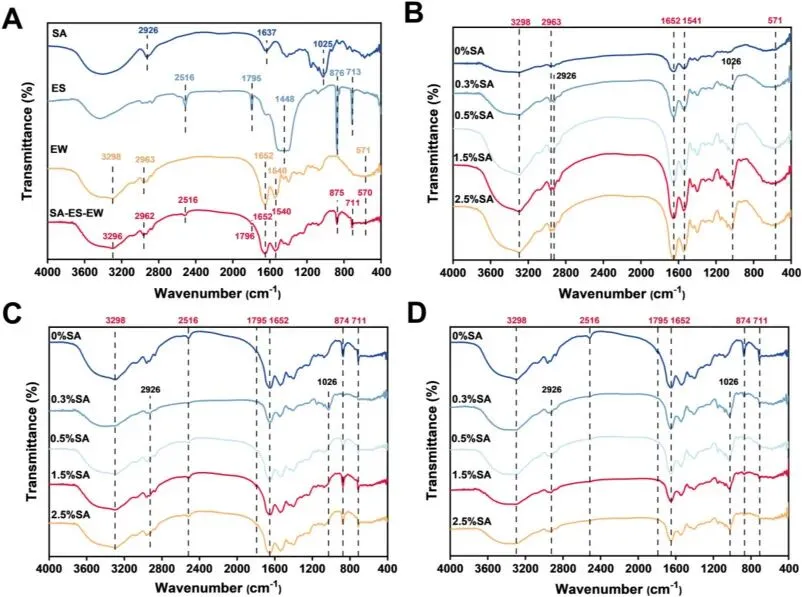
蛋壳粉的主要成分碳酸钙在体系中溶解,释放碳酸根使体系 pH 升至 8.2-8.6,同时释放 10-22mM 的可溶性 Ca²+;海藻酸钠的羧基可螯合 Ca²+ 形成经典 “蛋盒” 交联结构,进一步促进碳酸钙的持续溶解与 Ca²+ 释放。光谱与红外表征结果显示,二者协同诱导蛋清蛋白形成更紧凑的构象,减少了芳香族残基的暴露,体系通过静电作用、氢键及 Ca²+ 介导的交联形成多组分复合网络,同时提升了体系负 zeta 电位的绝对值,增强了胶体的静电稳定性。
体相与界面流变特性的强化规律
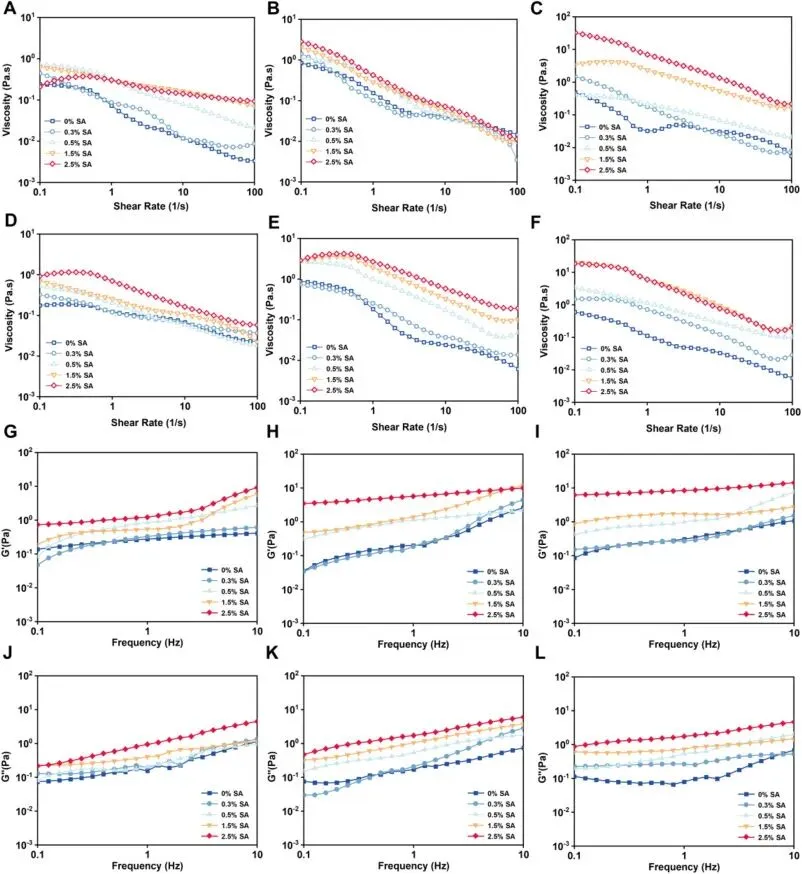
海藻酸钠 - 蛋壳粉复配体系呈现典型的剪切稀化行为,二者协同显著提升了体系的粘度与储能模量(G'),使泡沫体系从粘性主导转向弹性主导的弱凝胶结构,增强了泡沫的抗变形能力。界面流变与吸附动力学结果显示,二者协同构建了更致密、高弹性的复合界面膜,最优配方的界面扩张模量与弹性模量均显著高于单一体系,大幅增强了界面膜的机械强度与抗破裂能力。
无糖戚风蛋糕的应用验证效果
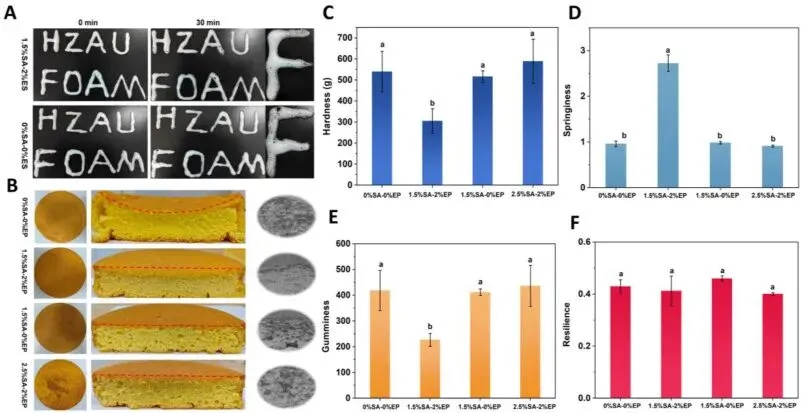
将 1.5% 海藻酸钠 - 2% 蛋壳粉的最优配方应用于无糖戚风蛋糕,可有效抑制烘焙过程中的蛋糕塌陷,形成更均匀、细密的内部气孔结构;所得蛋糕的硬度最低、弹性与回复性最优,同时与对照组相比无显著的外观色差,在不影响产品外观的前提下,显著优化了无糖戚风蛋糕的质构特性与食用品质,同时实现了蛋壳副产物的高值化利用。
Fig. 1. FC (A), FS (B), pH (C), soluble Ca2+ concentration (D), and representative macroscopic images (E) of EWP dispersions prepared with different SA (0, 0.3, 0.5, 1.5, and 2.5%, w/v) and EP (0, 1, and 2%, w/v) concentrations. Different letters indicate significant differences (P < 0.05).
Fig. 2. Turbidity (A), representative macroscopic images of dispersions (B) and zeta potential (C) of EWP dispersions prepared with different SA (0, 0.3, 0.5, 1.5, and 2.5%, w/v) and EP (0, 1, and 2%, w/v) concentrations. Particle size distributions of EWP dispersions prepared with different sodium alginate concentrations (0, 0.3, 0.5, 1.5, and 2.5% w/v) at 0% EP (D), 1% EP (E), and 2% EP (F). Different letters indicate significant differences (P < 0.05).
Fig. 3. UV-Vis spectra of EWP dispersions prepared with different sodium alginate (SA) and eggshell powder (EP) concentrations: 0% EP with 0, 0.3, 0.5, 1.5, and 2.5% SA (A); 1% EP with 0, 0.3, 0.5, 1.5, and 2.5% SA (B); and 2% EP with 0, 0.3, 0.5, 1.5, and 2.5% SA (C). Second-derivative UV spectra of the corresponding samples: 0% EP (D), 1% EP (E), and 2% EP (F). Heatmap of the characteristic ratio r values calculated from the second-derivative spectra for all groups (G).
Fig. 4. Intrinsic fluorescence spectra of EWP dispersions prepared with different SA and EP concentrations: 0% EP with 0, 0.3, 0.5, 1.5, and 2.5% SA (A); 1% EP with 0, 0.3, 0.5, 1.5, and 2.5% SA (B); and 2% EP with 0, 0.3, 0.5, 1.5, and 2.5% SA (C). Heatmap summarizing the fluorescence intensity of all groups (D).
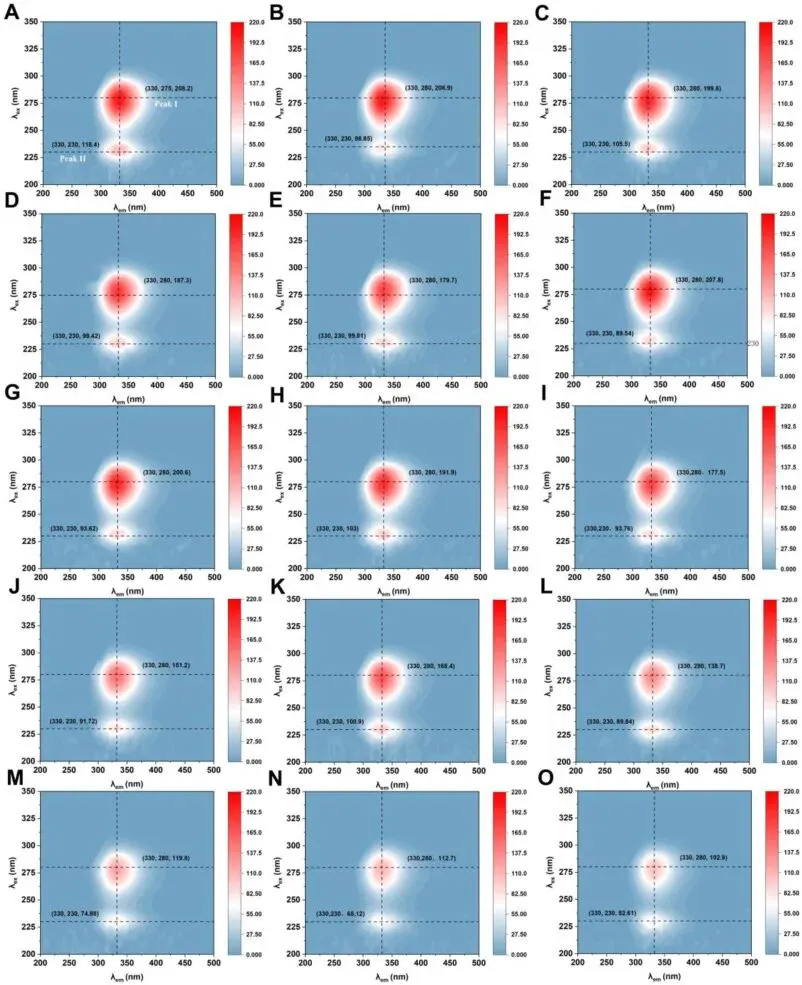
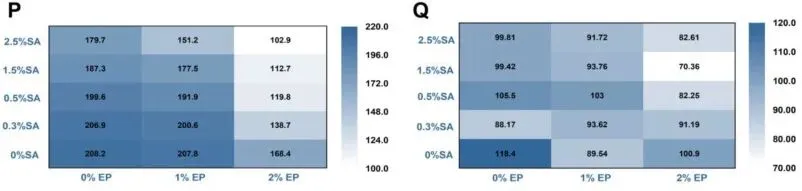
Fig. 5. EEM spectra of EWP dispersions prepared with different SA and EP concentrations: 0% EP with 0, 0.3, 0.5, 1.5, and 2.5% SA (A-E); 1% EP with 0, 0.3, 0.5, 1.5, and 2.5% SA (F-J); and 2% EP with 0, 0.3, 0.5, 1.5, and 2.5% SA (K-O). Heatmaps of Peak I intensity (P) and Peak II intensity (Q) extracted from the EEM spectra.
Fig. 6. FTIR spectra of SA, EWP, and EP as single components (A), and FTIR spectra of EWP dispersions prepared with different SA concentrations (0, 0.3, 0.5, 1.5, and 2.5%) in the presence of 0% EP (B), 1% EP (C), and 2% EP (D).
Fig. 7. Multiple light scattering profiles and TSI of foams prepared with different SA and EP concentrations. (A) Time-dependent transmittance (T%) and backscattering (BS%) profiles along sample height for foams prepared with different SA and EP concentrations. (B-D) TSI evolution of foams prepared with SA concentrations of 0, 0.3, 0.5, 1.5, and 2.5% at EP concentrations of 0% (B), 1% (C), and 2% (D).
Fig. 8. Rheological properties of dispersions and foams prepared with different sodium alginate (SA) and eggshell powder (EP) concentrations. (A-C) Apparent viscosity of the dispersions prepared with SA concentrations of 0, 0.3, 0.5, 1.5, and 2.5% at EP concentrations of 0% (A), 1% (B), and 2% (C). (D-F) Apparent viscosity of the corresponding foams prepared with SA concentrations of 0, 0.3, 0.5, 1.5, and 2.5% at EP concentrations of 0% (D), 1% (E), and 2% (F). (G-I) Storage modulus (G′) and loss modulus (G″) of the dispersions prepared with SA concentrations of 0, 0.3, 0.5, 1.5, and 2.5% at EP concentrations of 0% (G), 1% (H), and 2% (I). (J-L) Storage modulus (G′) and loss modulus (G″) of the corresponding foams prepared with SA concentrations of 0, 0.3, 0.5, 1.5, and 2.5% at EP concentrations of 0% (J), 1% (K), and 2% (L).
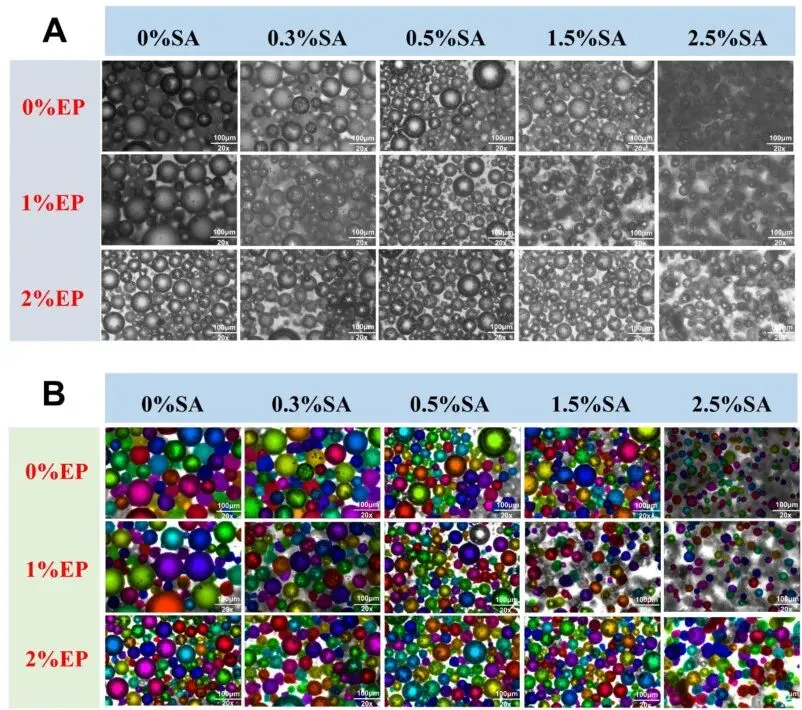
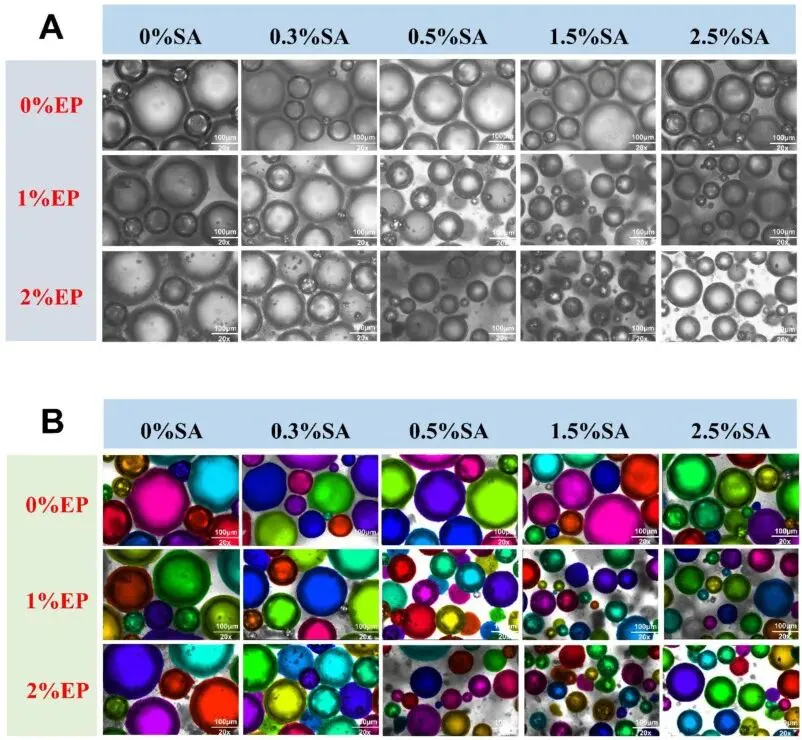
Fig. 9. Representative optical micrographs of freshly prepared foams (0 min) produced with different SA and EP concentrations (A), and the corresponding segmented images obtained by the deep learning-based Cellpose algorithm for bubble identification and size analysis (B).
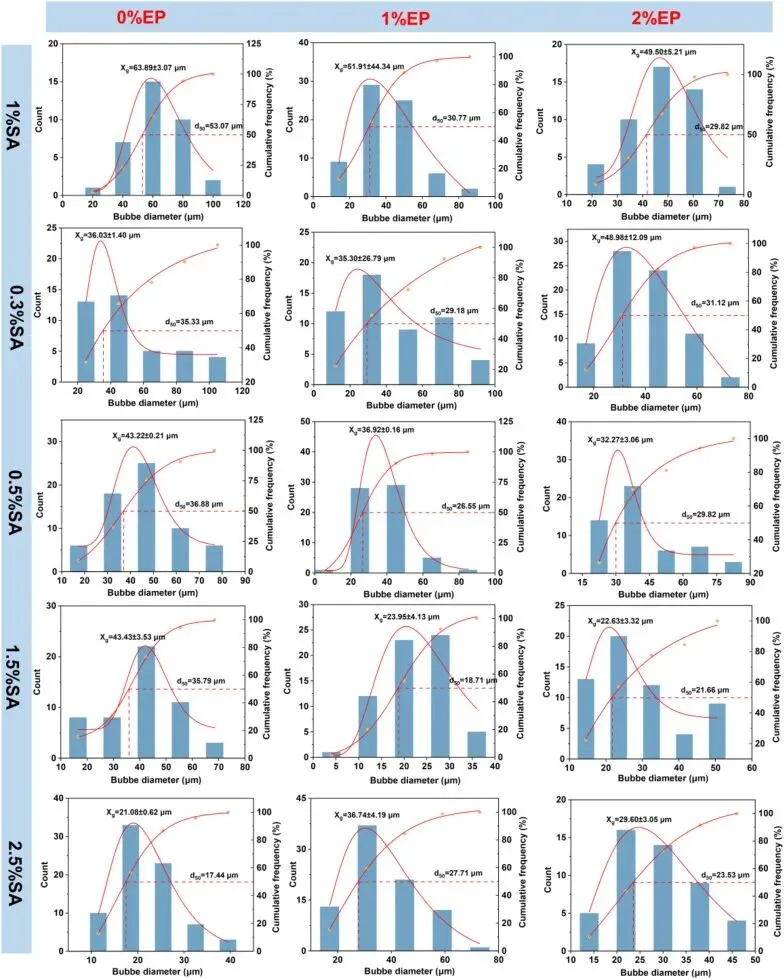
Fig. 10. Bubble number and diameter distributions of freshly prepared foams (0 min) formulated with different SA and EP concentrations, quantified from optical micrographs using ImageJ after bubble identification/segmentation. Histograms show bubble counts as a function of diameter, and the cumulative frequency curves indicate the corresponding size distribution.
Fig. 11. Representative optical micrographs of foams after 30 min standing prepared with different SA and EP concentrations (A), and the corresponding segmented images processed by the deep learning-based Cellpose algorithm for bubble identification and size analysis (B).
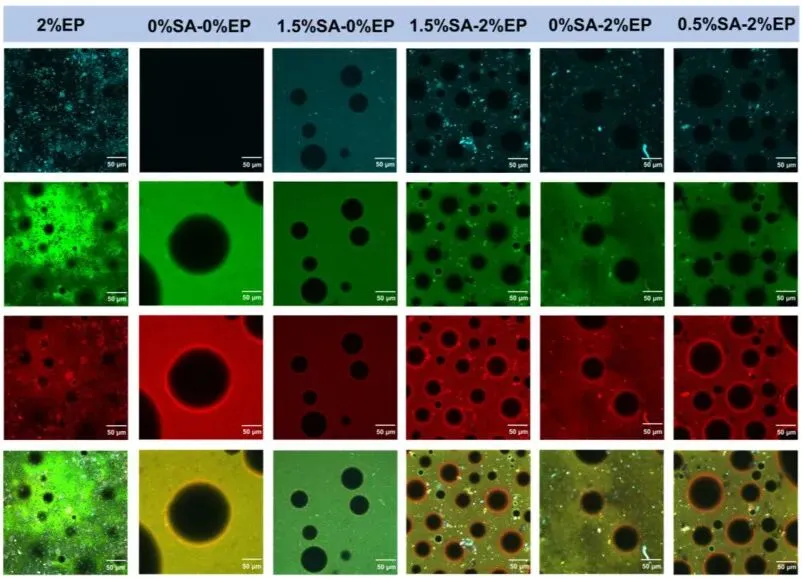
Fig. 12. CLSM images of foams prepared with different SA and EP formulations (2% EP, 0% SA-0% EP, 1.5% SA-0% EP, 1.5% SA-2% EP, 0% SA-2% EP, and 0.5% SA-2% EP). The first row shows the fluorescent whitening agent channel, the second row shows the FITC channel, the third row shows the Rhodamine B channel, and the fourth row shows the merged images. Scale bar = 50 μm.
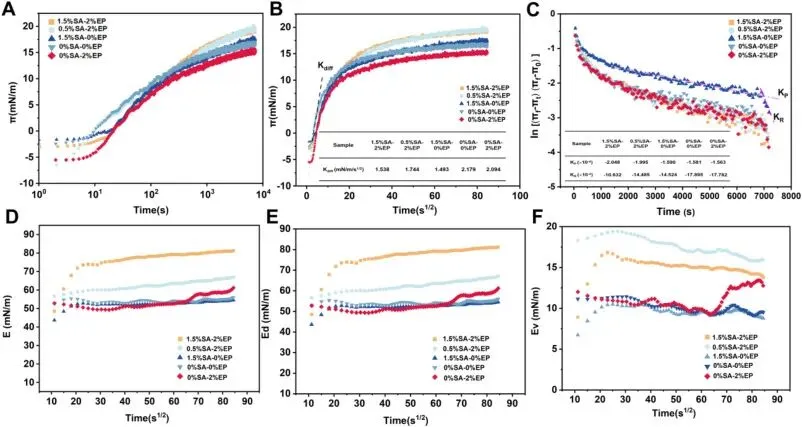
Fig. 13. Interfacial adsorption kinetics and interfacial dilatational rheology of selected EWP foams prepared with different SA-EP formulations. Interfacial pressure (π) as a function of time (A) and t1/2 (B), where the initial linear region was used to obtain the diffusion rate constant (Kdiff). (C) Ward-Tordai analysis of ln[(πf−πt)/(πf−π0)] versus time for estimating the penetration (KP) and rearrangement (KR) rate constants. Time evolution of the interfacial complex dilatational modulus (E) (D), interfacial elastic modulus (Ed) (E), and interfacial viscous modulus (Ev) (F) during adsorption.
Fig. 14. Application of optimized EWP-SA-EP foams in sugar-free chiffon cakes. Representative macroscopic appearance of freshly prepared foams at 0 and 30 min for selected formulations (A). Top-view images, cross-sectional crumb morphology, and corresponding pore-structure maps of sugar-free chiffon cakes prepared with different foams (B). Texture profile analysis parameters, including hardness (C), springiness (D), gumminess (E), and resilience (F), of the resulting cakes. Different letters indicate significant differences (P < 0.05).
https://doi.org/10.1016/j.foodhyd.2026.112688
免责声明:「原创」仅代表原创编译,水平有限,仅供学术交流,本平台不主张原文的版权,如有侵权,请联系删除。文献解读或作者简历如有疏漏之处,我们深表歉意,请作者团队及时联系《食探未来》主编(微信号:shitanweilai8077),我们会在第一时间进行修改或撤稿重发,感谢您的谅解!