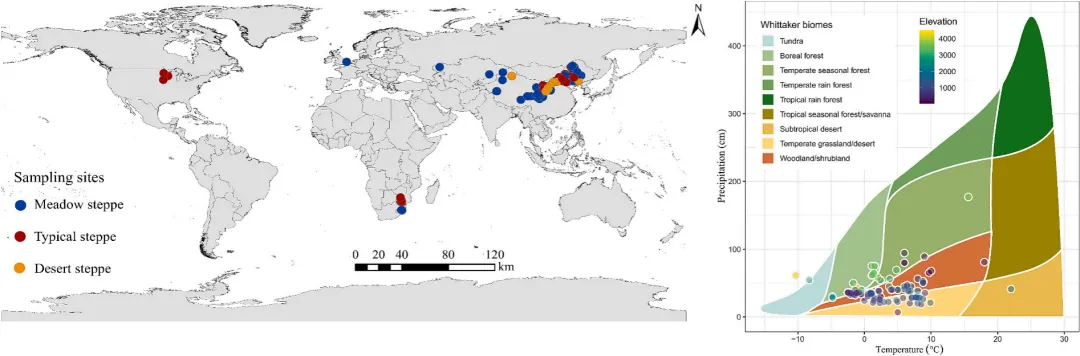
欢迎点击上方名片关注!推送等相关事宜直接后台私信即可!大气氮沉降作为全球变化的重要驱动因素之一,对草地生态系统中碳(C)、氮(N)和磷(P)的生物地球化学循环及其化学计量比(C:N:P)产生了深远影响。本研究通过对83篇已发表研究中的1168个观测数据进行元分析(meta-analysis),定量评估了氮添加对全球草地中植物、土壤和微生物C:N:P化学计量特征的影响。结果表明,氮添加显著提高了植物碳含量和土壤有机碳(SOC)含量,并增加了植物、土壤和微生物生物量中的氮含量。同时,氮添加使植物叶片和土壤的C:N比分别降低了17.3%和2.7%。此外,氮添加显著提高了植物叶片(32.2%)、土壤(9.3%)和微生物生物量(16.8%)中的N:P比。这些化学计量学响应在很大程度上受到氮输入速率和实验持续时间的调节,但在不同气候背景下总体表现出较为一致的模式。总体而言,本研究结果为理解氮沉降如何改变草地生态系统中的元素循环及化学计量平衡提供了新的见解,同时有助于提高生态系统模型的预测准确性,并为在全球变化背景下减缓不断增加的氮沉降影响提供管理策略依据。Fig. 1. Sampling Sites and Biome Distribution The left panel shows the geographic locations of study sites included in this meta-analysis. Blue, red, and yellow circles represent study sites in meadow grasslands, typical grasslands, and desert grasslands, respectively. The right panel displays biomes across all field conditions.
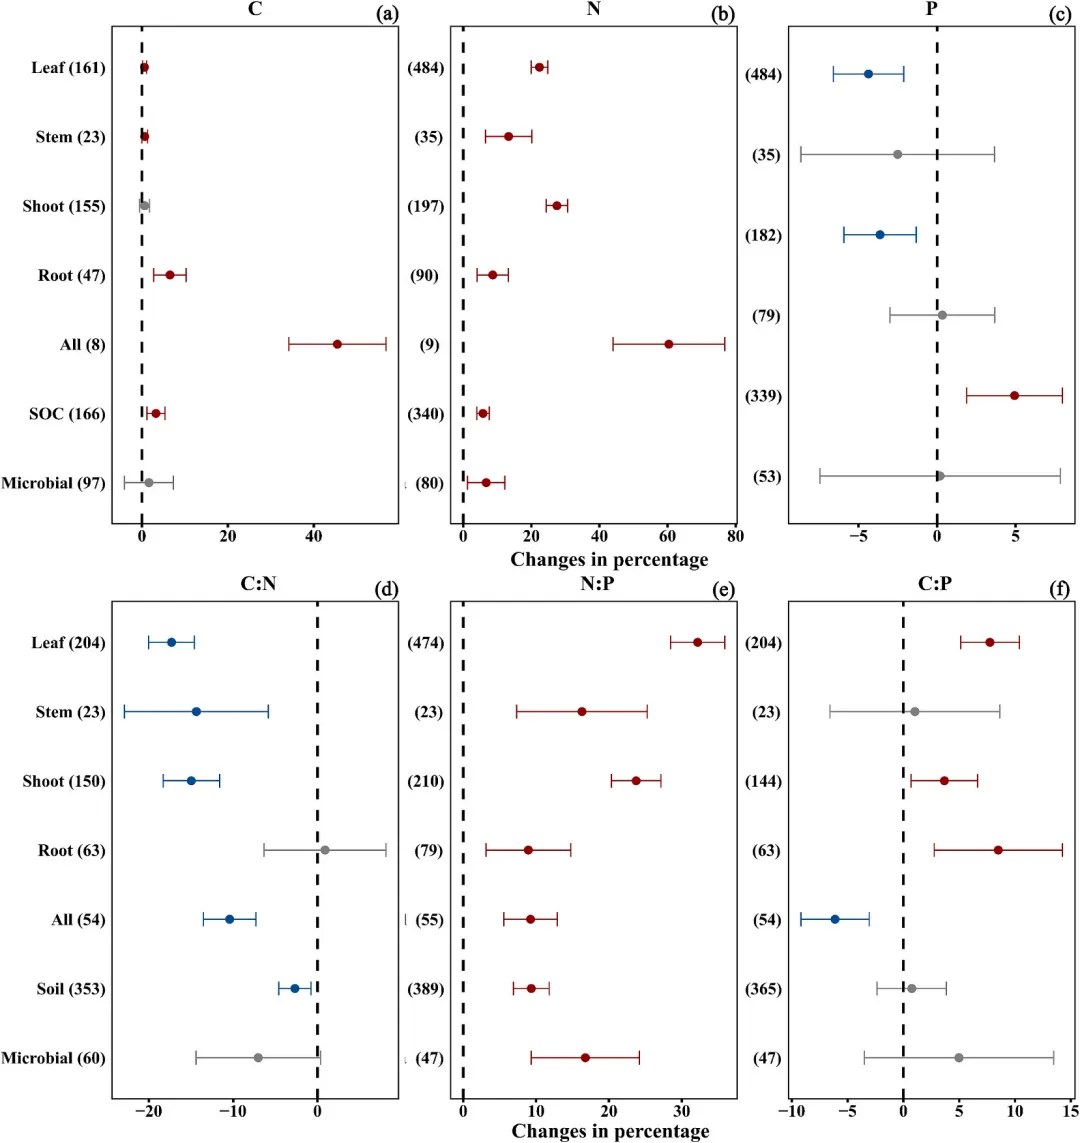
Fig. 2. Response of C (a), N (b), and P (c) content, as well as C:N (d), N:P (e), and C:P (f) ratios in plant leaves, stems, shoot, roots, total plant biomass, soil, and microbial biomass to nitrogen addition (percentage change relative to control). Nitrogen addition effects are significant when the 95% confidence interval (CI) does not overlap with zero. Red solid dots indicate significant positive effects; blue solid dots indicate significant negative effects.
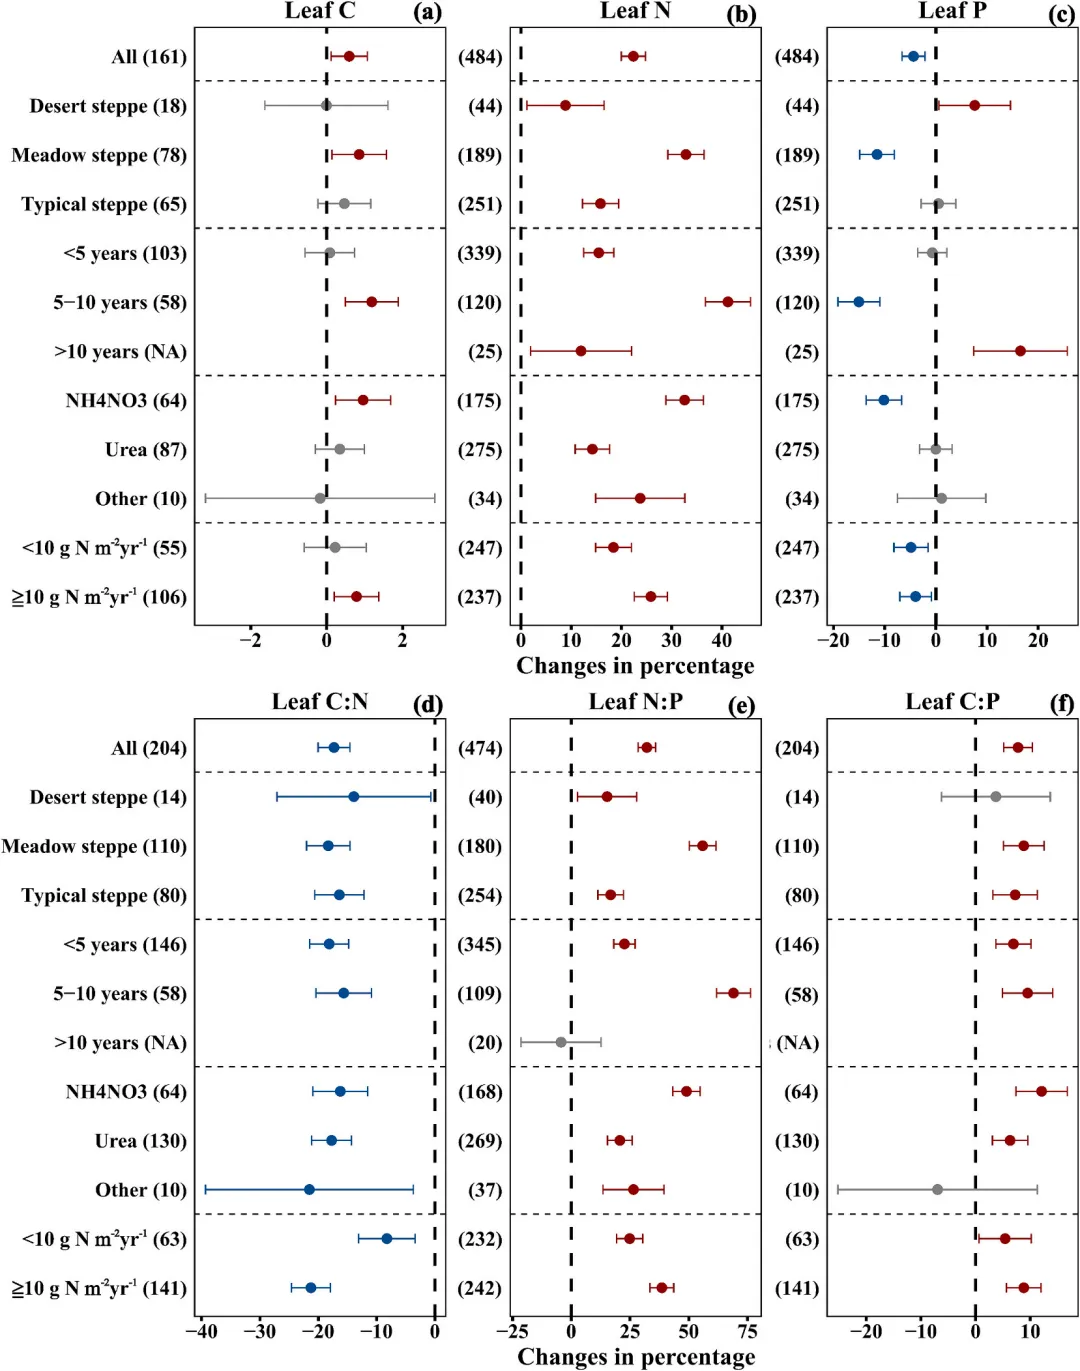
Fig. 3. Response of grass leaf chemotrophic traits to nitrogen addition (percentage change relative to control). Effects of nitrogen addition are significant when the 95% confidence interval (CI) does not overlap with zero. Red solid dots indicate significant positive effects; blue solid dots indicate significant negative effects. Each panel is organized by grassland type, duration of nitrogen application, nitrogen fertilizer type, and nitrogen input rate.
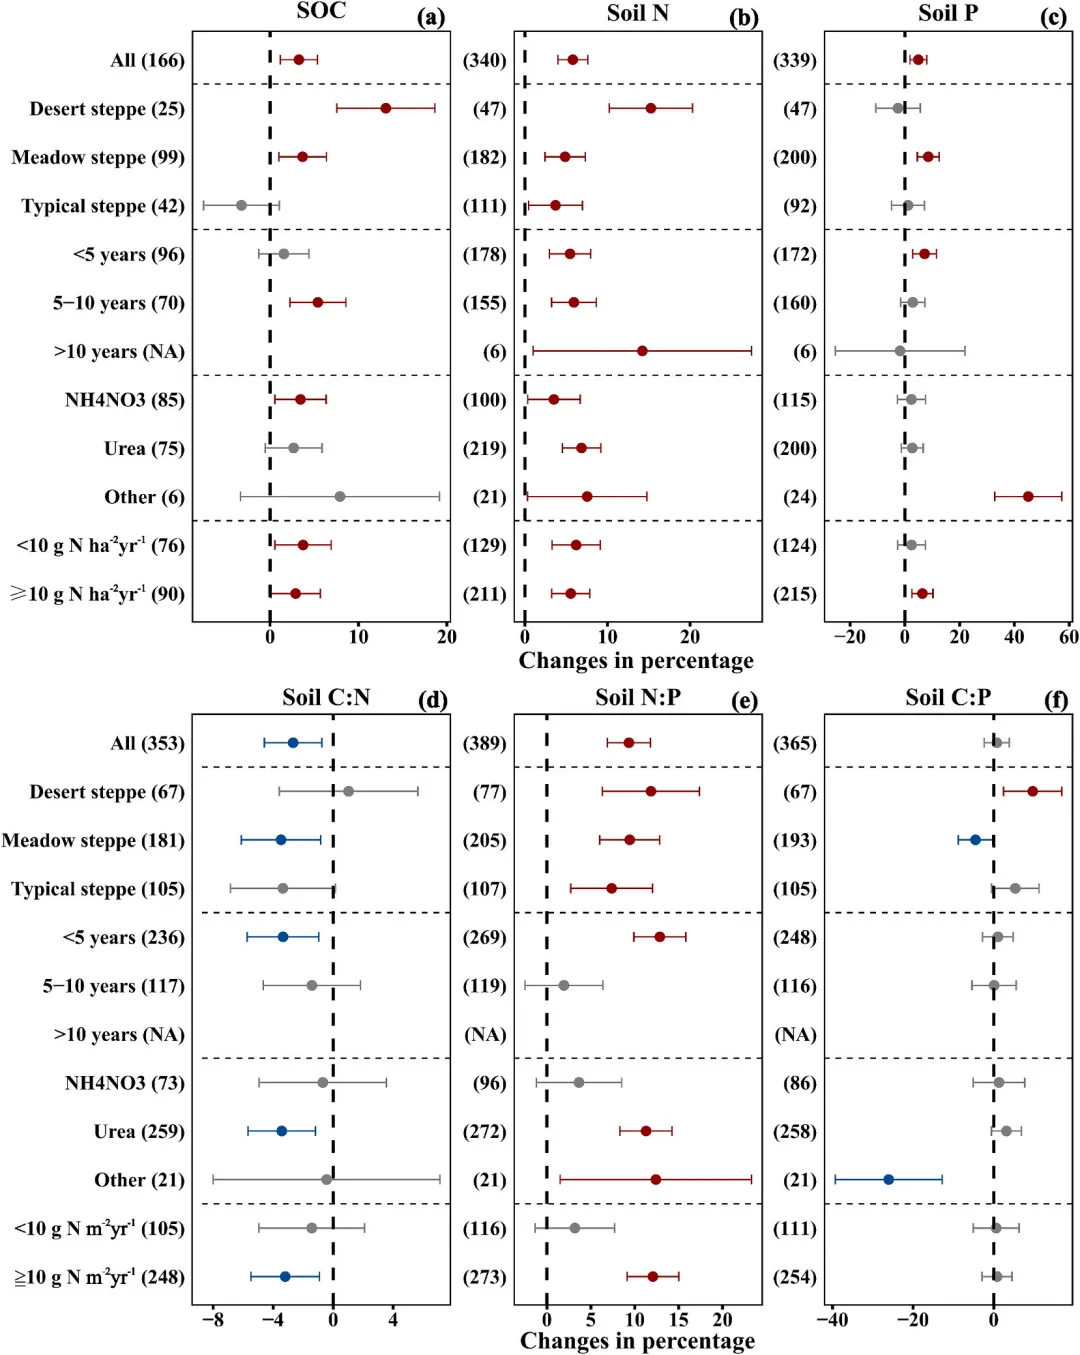
Fig. 4. Response of soil chemical characteristics to nitrogen addition (percentage change relative to the control). Effects of nitrogen addition are significant when the 95% confidence interval (CI) does not overlap with zero. Red solid dots indicate significant positive effects; blue solid dots indicate significant negative effects. Each panel is organized by grassland type, duration of nitrogen application, nitrogen fertilizer type, and nitrogen input rate.
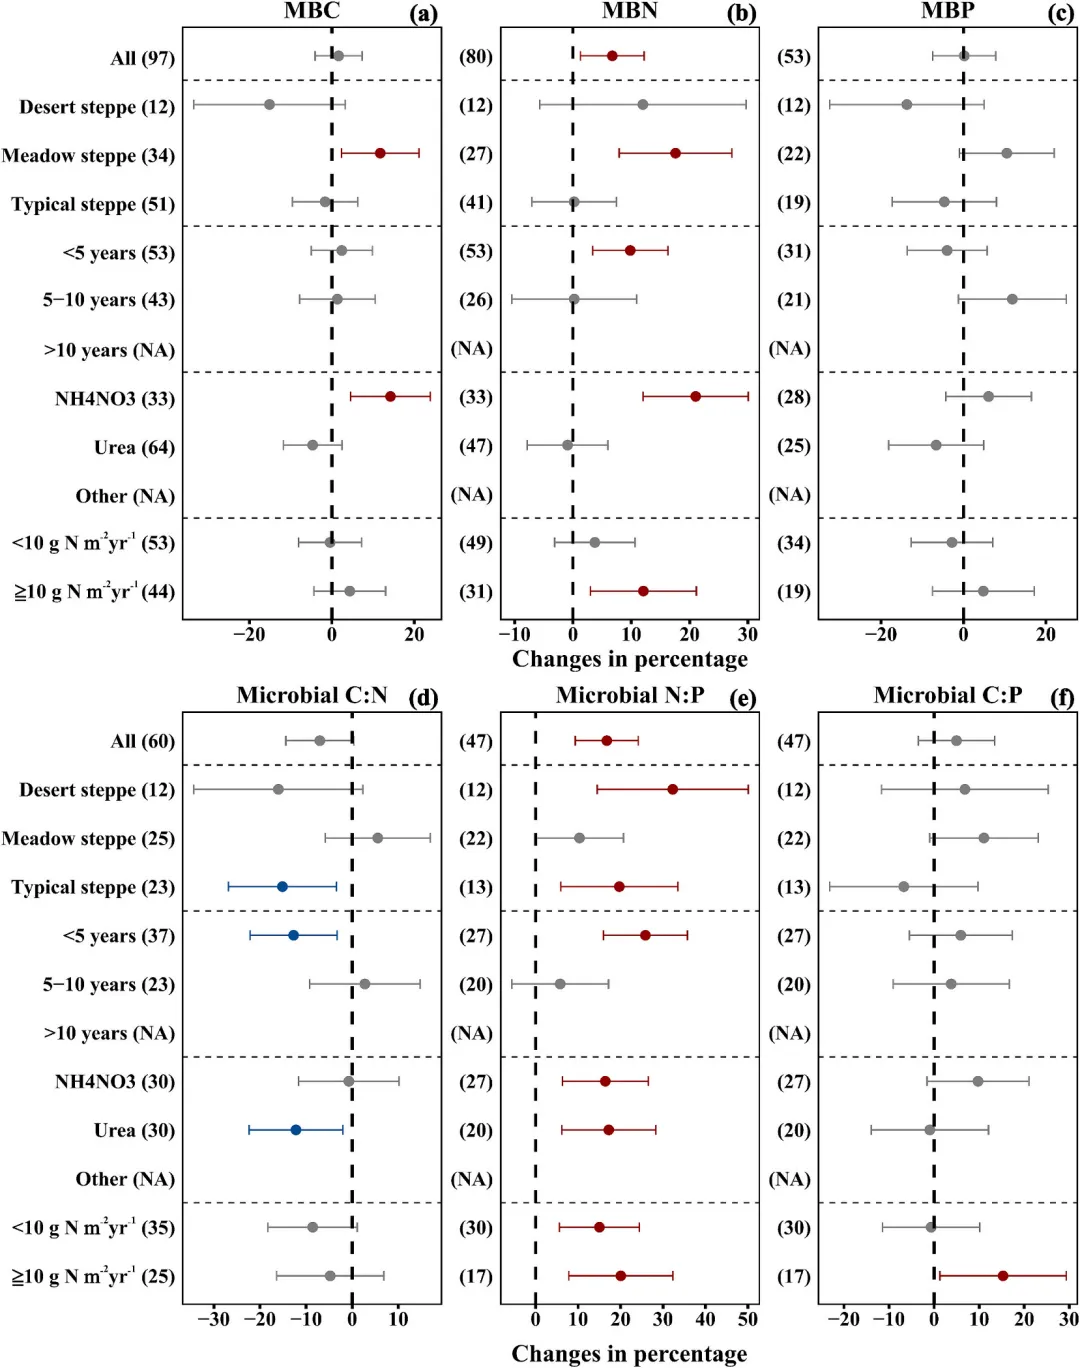
Fig. 5. Response of microbial biomass stoichiometric characteristics to nitrogen addition (percentage change relative to the control). Effects of nitrogen addition are significant when the 95% confidence interval (CI) does not overlap with zero. Red solid dots indicate significant positive effects; blue solid dots indicate significant negative effects. Each panel is organized by grassland type, duration of nitrogen application, nitrogen fertilizer type, and nitrogen input rate.
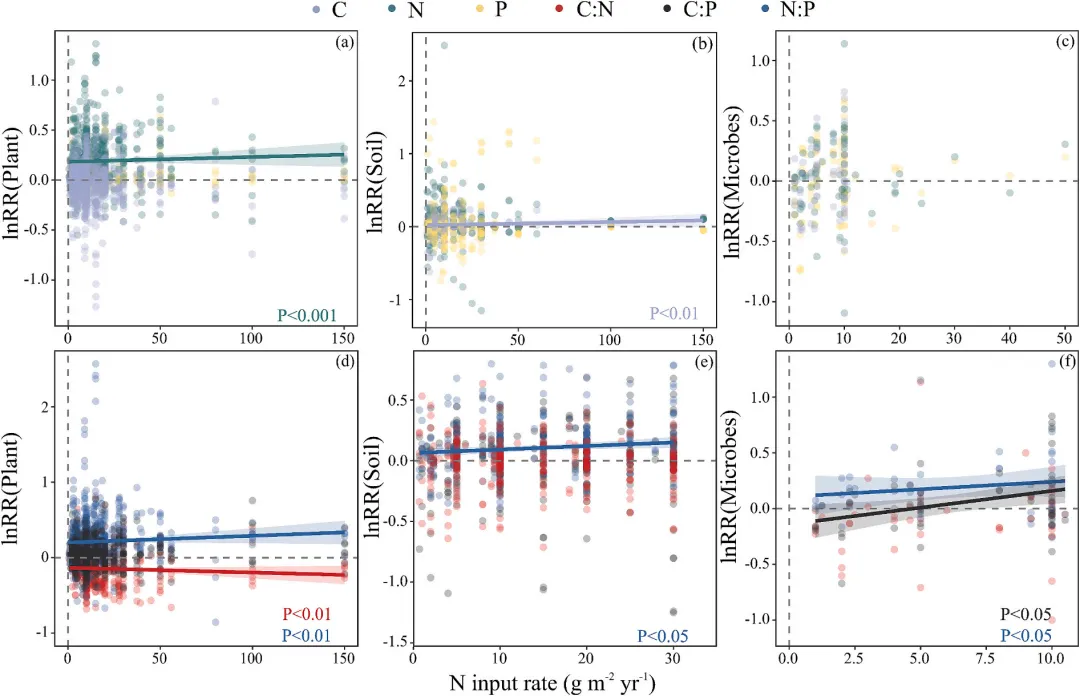
Fig. 6. Mixed linear model of plant, soil, and microbial response ratios (lnRR) versus nitrogen input rate. (a) Response of plant C, N, and P to nitrogen input rate, (b) Response of soil organic C, N, and P to nitrogen input rate, (c) Response of MBC, MBN, and MBP to nitrogen input rate, (d) Response of plant C:N, C:P, and N:P to nitrogen input rate, (e) Response of soil C:N, C:P, and N:P to nitrogen input rate, (f) Response of microbial C:N to nitrogen input rate. Different scatter plot colors represent distinct stoichiometric ratios; solid lines corresponding to scatter plot colors indicate significant responses of that ratio to nitrogen input rate. P < 0.05indicates significance. R2m represents the marginal coefficient of determination, and R2c represents the conditional coefficient of determination. R2 and P values are presented in Table S2.
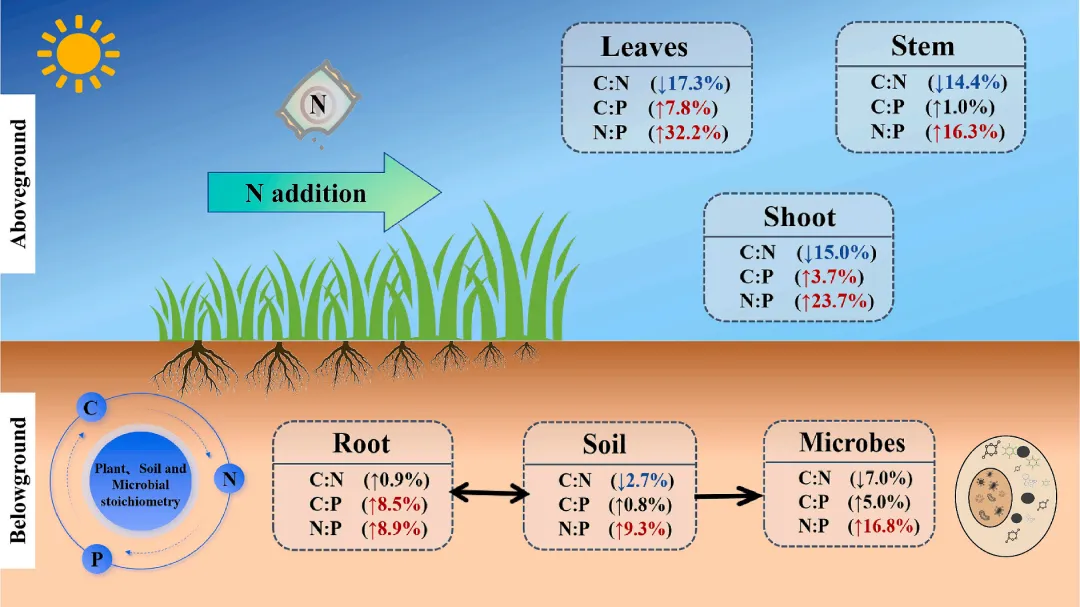
Fig. 9. Mechanism of nitrogen addition affecting the C:N:P stoichiometric characteristics of plants, soil, and microorganisms. Blue short arrows indicate a decrease in response to nitrogen addition, red short arrows indicate an increase in response to nitrogen addition, and black indicates no significant effect.
 10个月宝宝每天需要喝多少奶粉?
