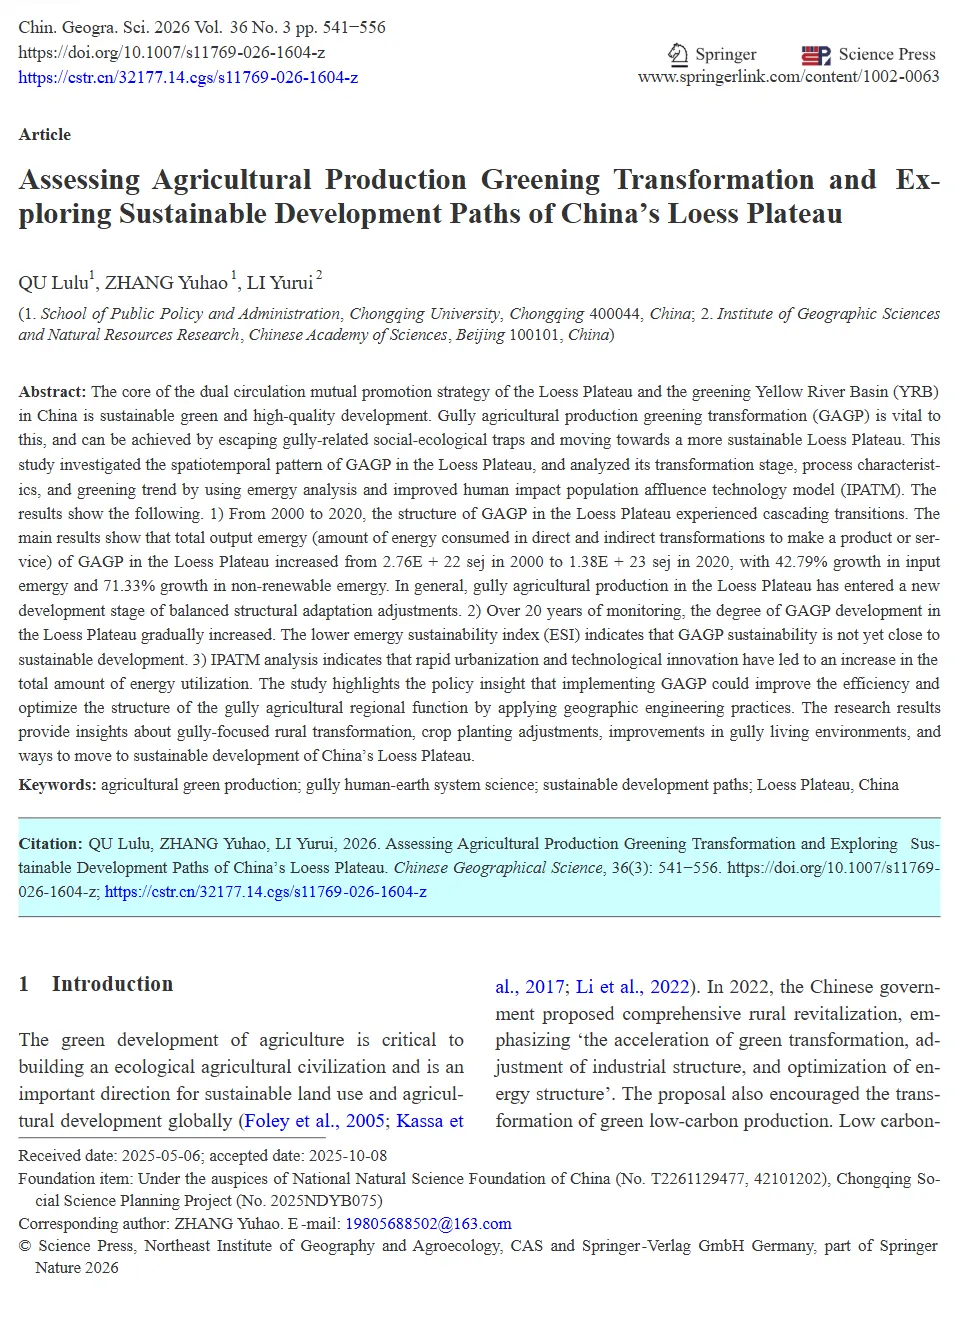
Fig. 1The process of gully agricultural production greening transformation (GAGP) evolution in the Loess Plateau, China. Scenario 1:green and high-quality development scenario; Scenario 2: slow development scenario; Scenario 3: declining development scenario
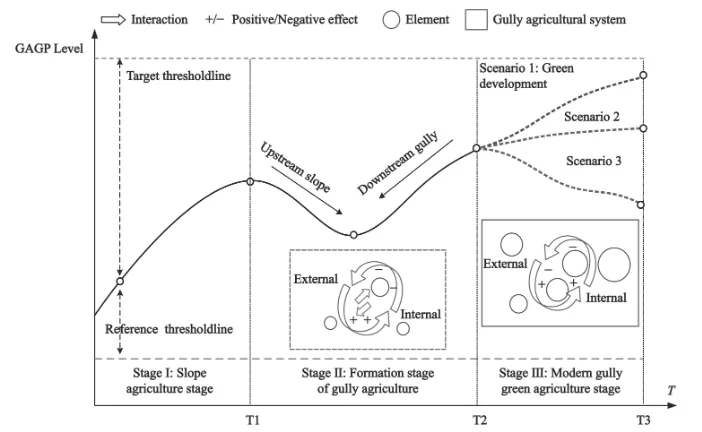
Fig. 2Conceptual framework for GAGP in the LP. Here, optimize planting structure corresponds to SDG2 (Zero Hungry), and SDG1 (No Poverty). Planting and breeding adjustment corresponds to SDG3 (Good Health and Well-being), and SDG6 (Clean Water and Sanitation). Ecological industrialization corresponds to SDG7 (Affordable and Clean Energy), and SDG13 (Climate Action). Other measures corresponds to SDG8 (Decent Work and Economic Growth), and SDG15 (Life on Land), representing the human pursuit of green welfare, which may come at the cost of resource consumption
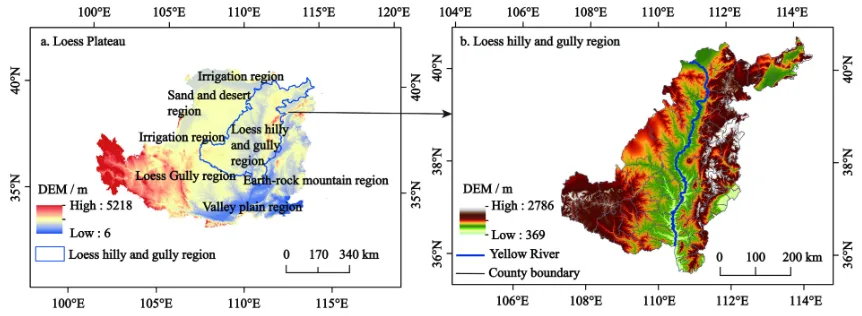
Fig. 3 Location of Loess hill and gully region in the LP
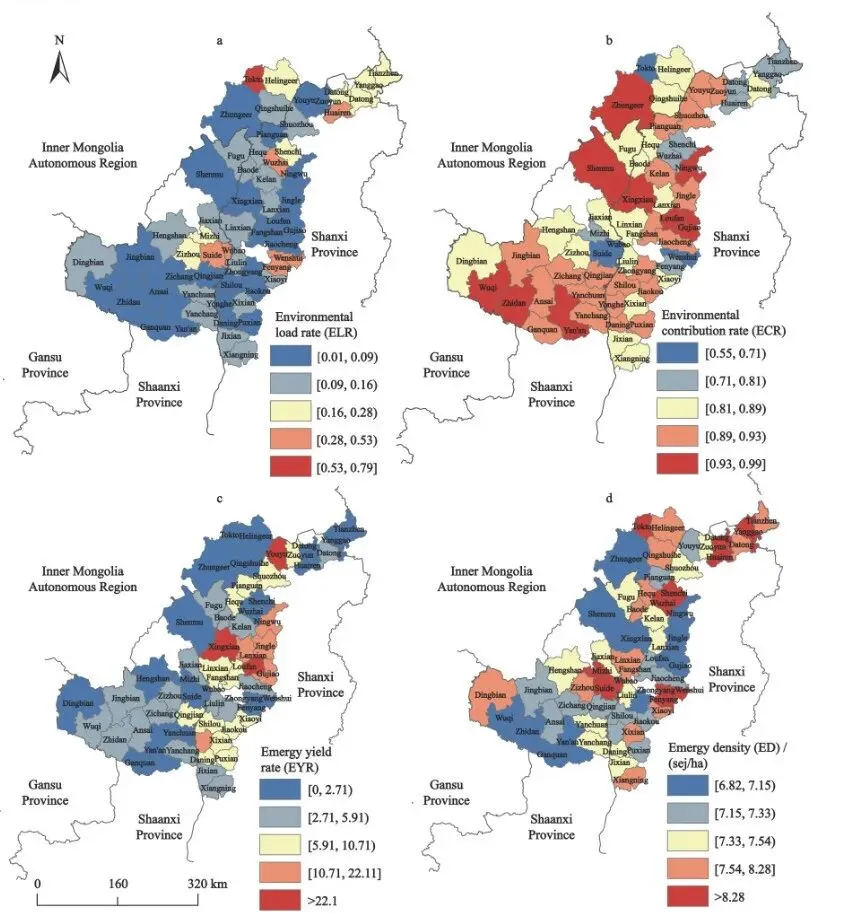
Fig. 4Spatial dynamics of GAGP in the Loess Plateau, China. a. Environmental load rate; b. Environmental contribution rate; c. Emergy yield rate; d. Emergy density in gully agriculture of the Loess Plateau
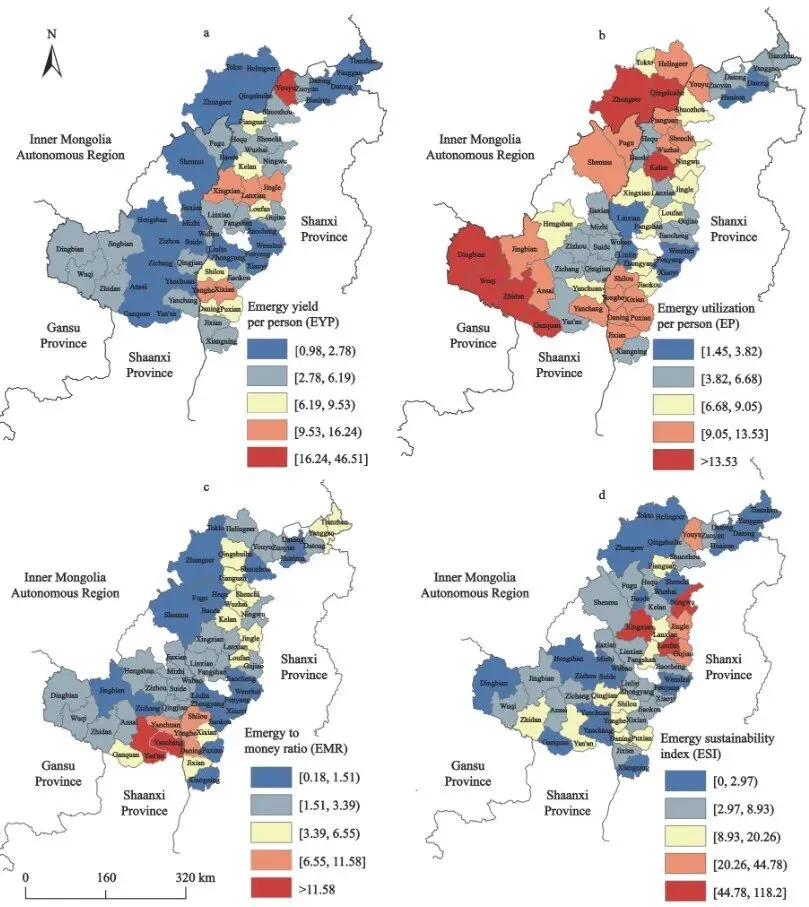
Fig. 5Spatial dynamics of GAGP in the Loess Plateau of China. a. Emergy yield per person (EYP); b. Emergy utilization per person (EP); c. Emergy to money ratio (EMR); d. Emergy sustainability index (ESI) of gully agriculture in the Loess Plateau, China
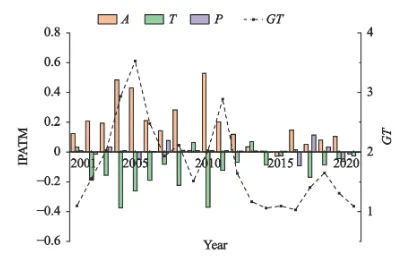
Fig. 6The results of the IPATM of GAGP in the Loess Plateau of China. Here, A refers to per capita GDP, and T refers emergy per GDP, and P refers to the population, and G refers to GDP. GT, agricultural production effect
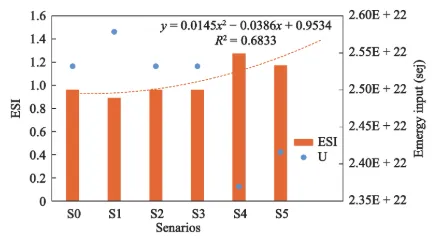
Fig. 7Indicators related to the sustainability of GAGP in 2030.ESI, emergy sustainability index. U, total input energy. S0 (thebaseline scenario, actual situation in 2020), S1 (adaptation to climate change), S2 (improved water-use efficiency), S3 (improvedenergy efficiency and efficient cleaner production), S4 (sustainable use and management of environment), S5 (hybrid scenario ofscenarios S1, S2, S3, and S4)